a16z 图表周报:苹果缺席 AI 资本开支竞赛,Roblox 用 AI 造游戏
苹果在 AI 资本开支竞赛中保持克制,其资本开支低于 AI 支出热潮前水平,而四大超大规模云厂商的资本开支自 2023 年以来增长了约 6 倍至 9 倍。与此同时,Roblox 财报显示 AI 正加速游戏开发,过去一个月排名前 100 的游戏中超过 80% 使用了 AI 工具。其提示词转游戏工具 Build 自 alpha 测试以来已有超 50 万用户使用并发布了超 7 万款游戏。

It’s been a tough month (well, really a tough few months) for the “AI Trade,” and as earnings continue to roll in, it’s been more of the same.
In terms of which companies have driven Nasdaq returns over the last 30 days, it’s definitely AI and AI-adjacent companies, but they’ve been driving Nasdaq in the wrong direction:
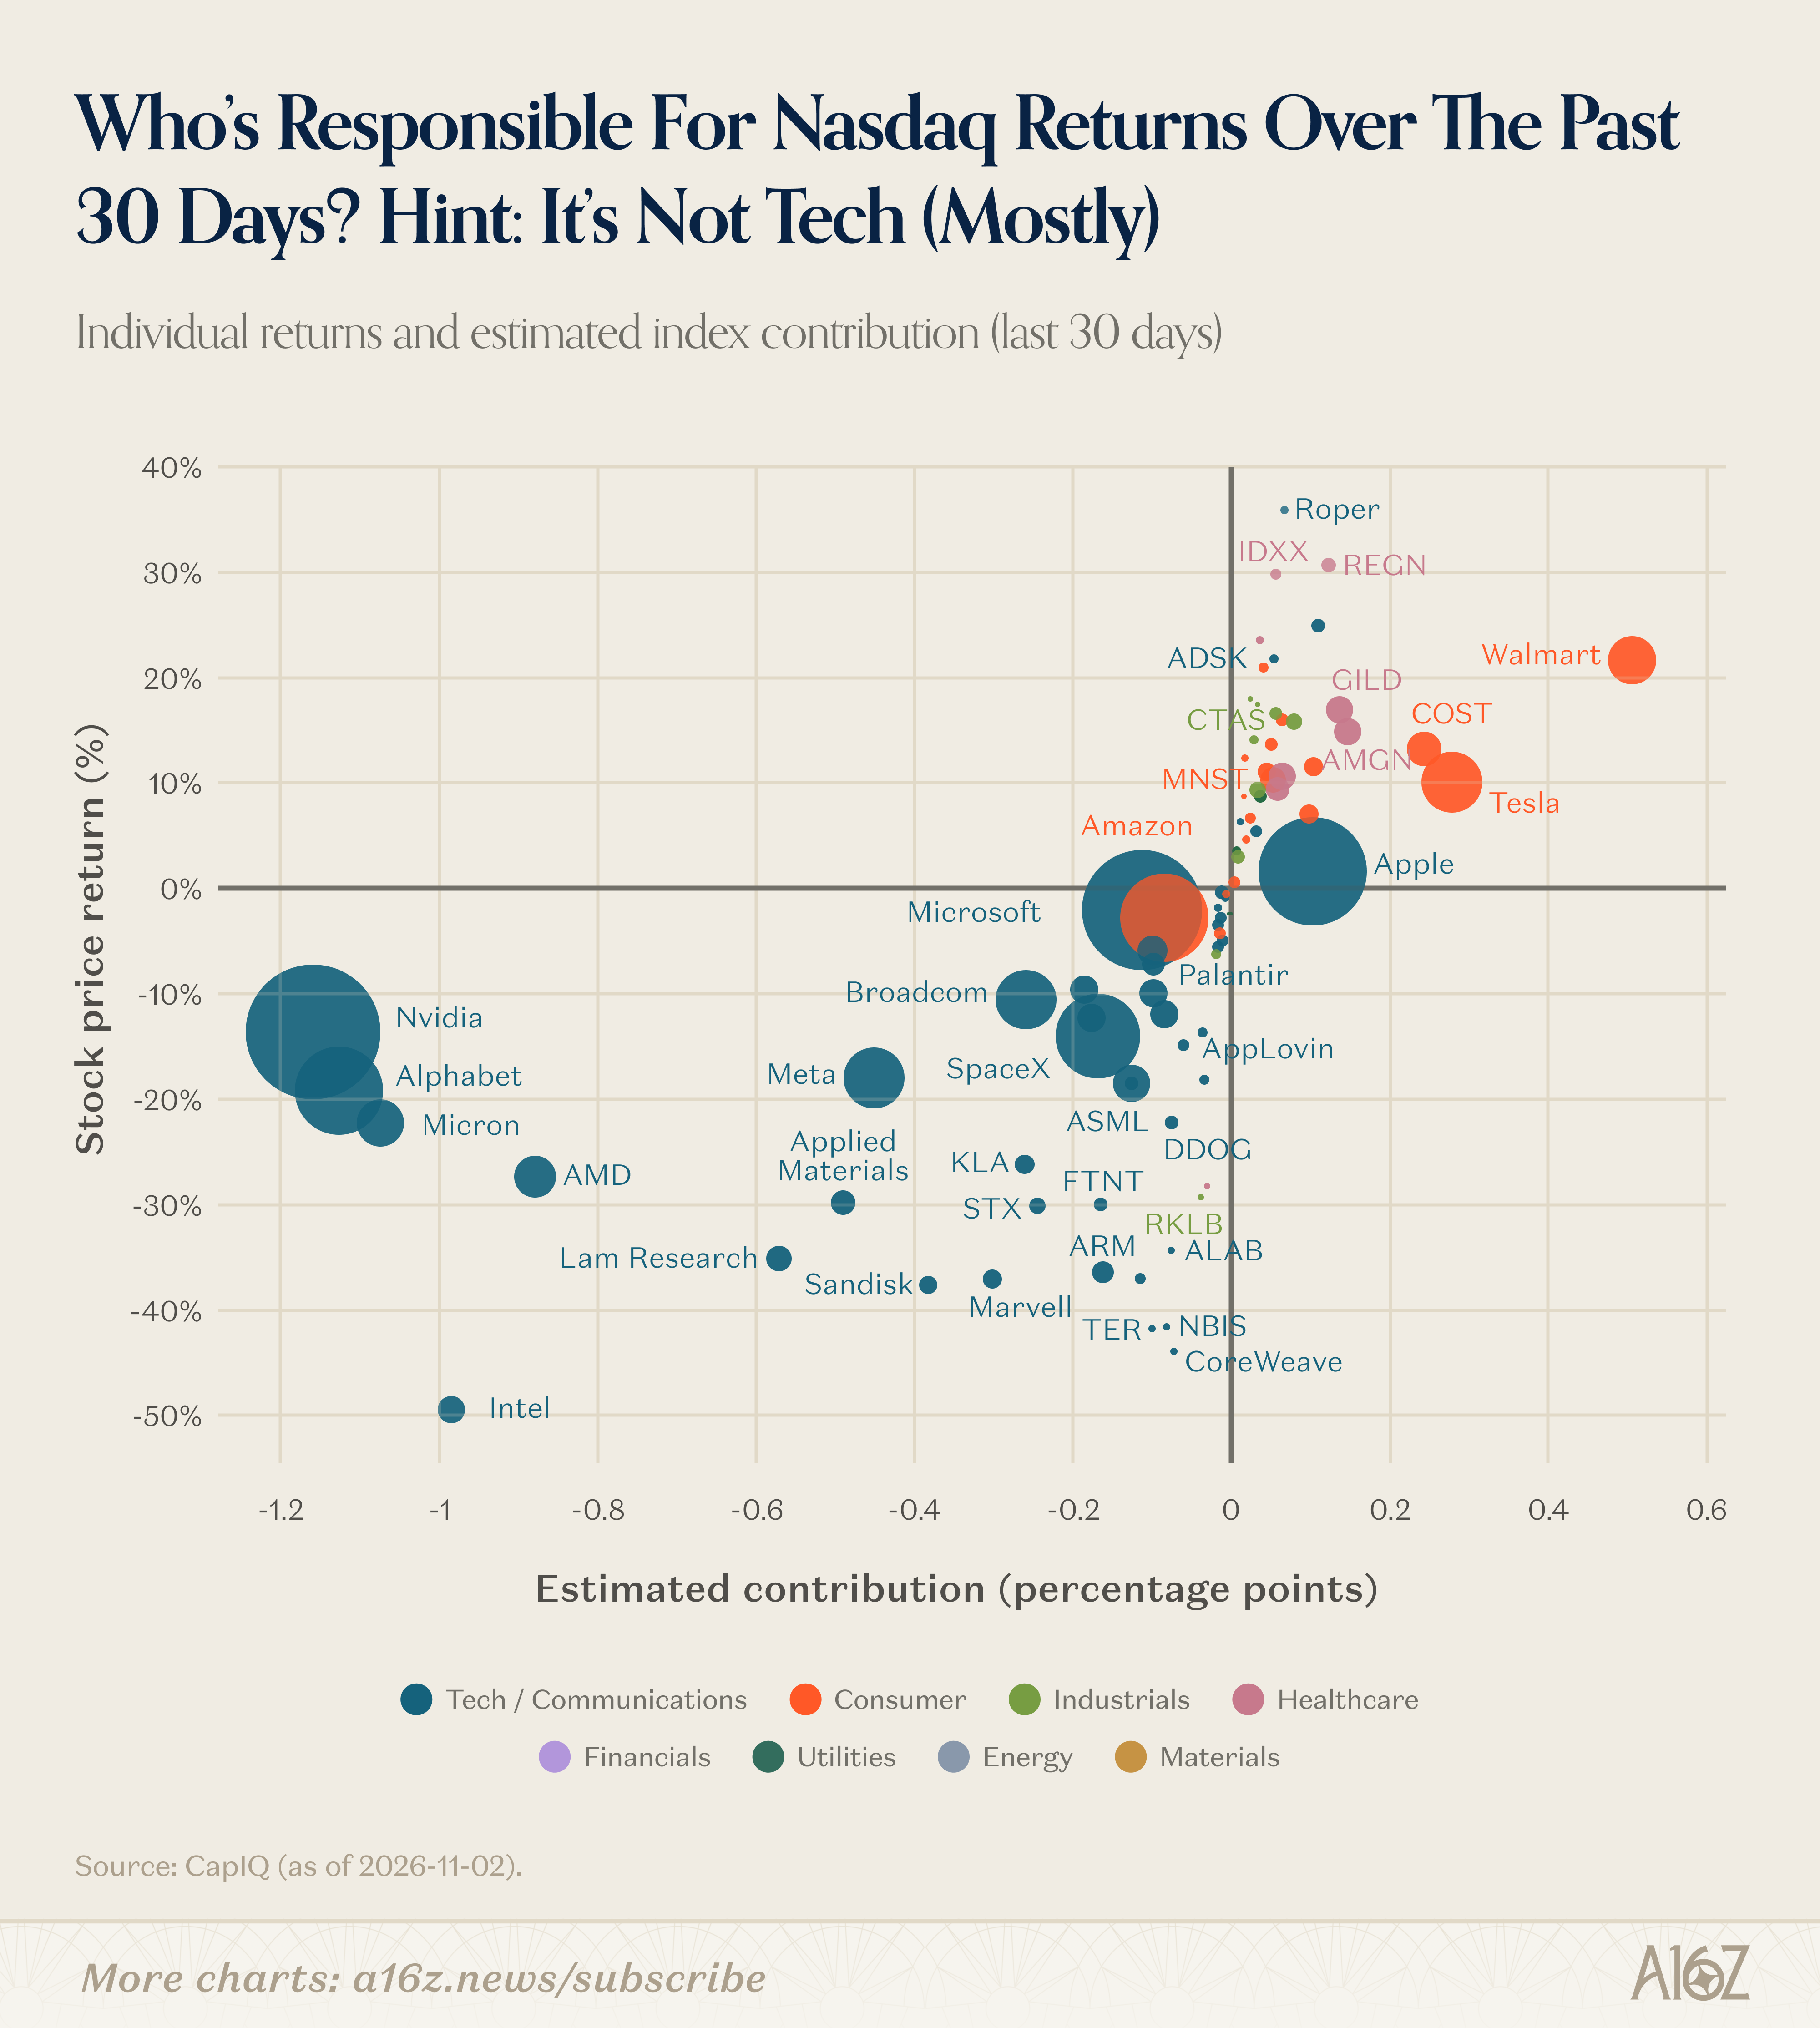
The bottom left quadrant is where the downward drag lives, and it’s full of hyperscalers, neoclouds, semis, and AI supply chain. The top right quadrant is where the (smaller) upward pull can be found, and the biggest contributors are household “tech” names, like . . . Costco and Walmart.
So, it hasn’t been a great month for tech. It happens. There, of course, are two notable exceptions: (1) Tesla, which is mostly a partial rebound off an otherwise moribund year (from a stock performance standpoint); and (2) Apple, which didn’t exactly knock it outta the park (on a returns basis), but was still a positive contributor to the index, unlike the rest of the “Big Tech” field.
In fact, as of earlier this week, Apple has been the only Mag7 company to beat either major index year-to-date:
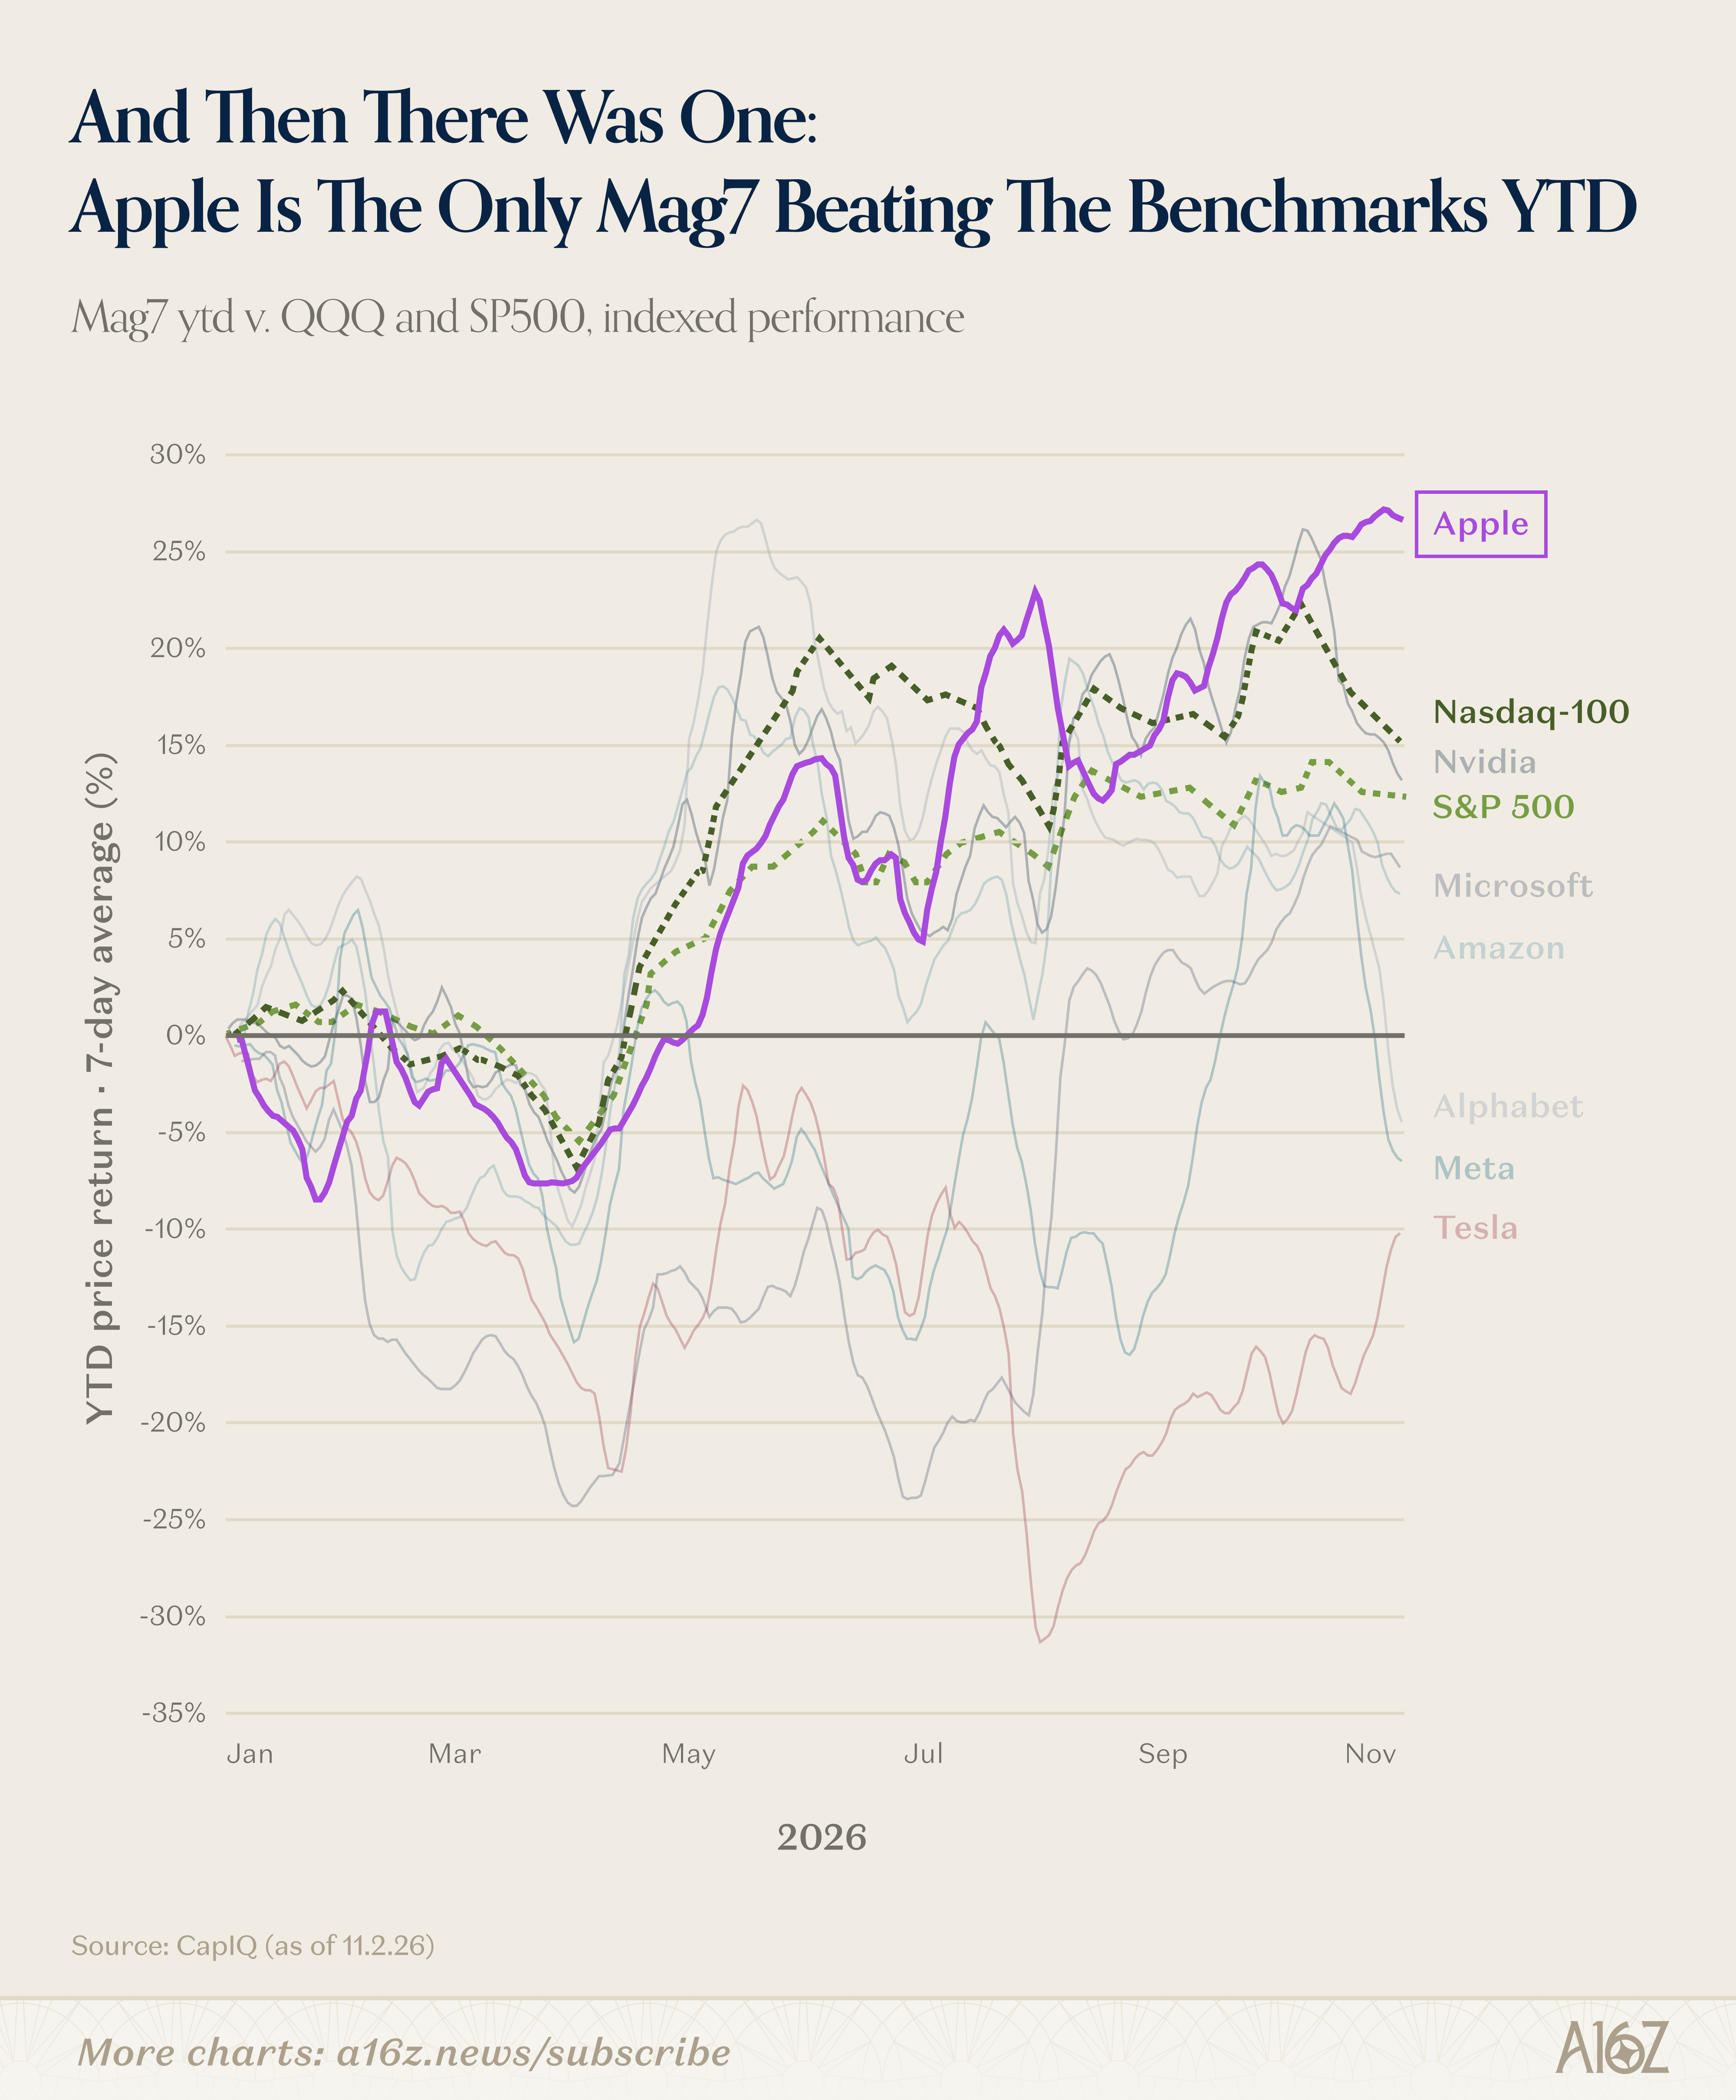
Only Apple has beaten Nasdaq this year, and while Nvidia still had a slim lead on the S&P 500 when the data was pulled for this chart (using rolling 7 day averages), that lead has since evaporated.
It’s a remarkable turnaround from the Mag7 concentration story of last year. Far from driving the index, big tech has largely lagged (while the beneficiaries of big tech spending pulled ahead).
And it’s that latter point about big tech spending where Apple really has “shined.” As Charts has observed in the past, when it comes to the AI arms race, Apple is really just sitting this one out:
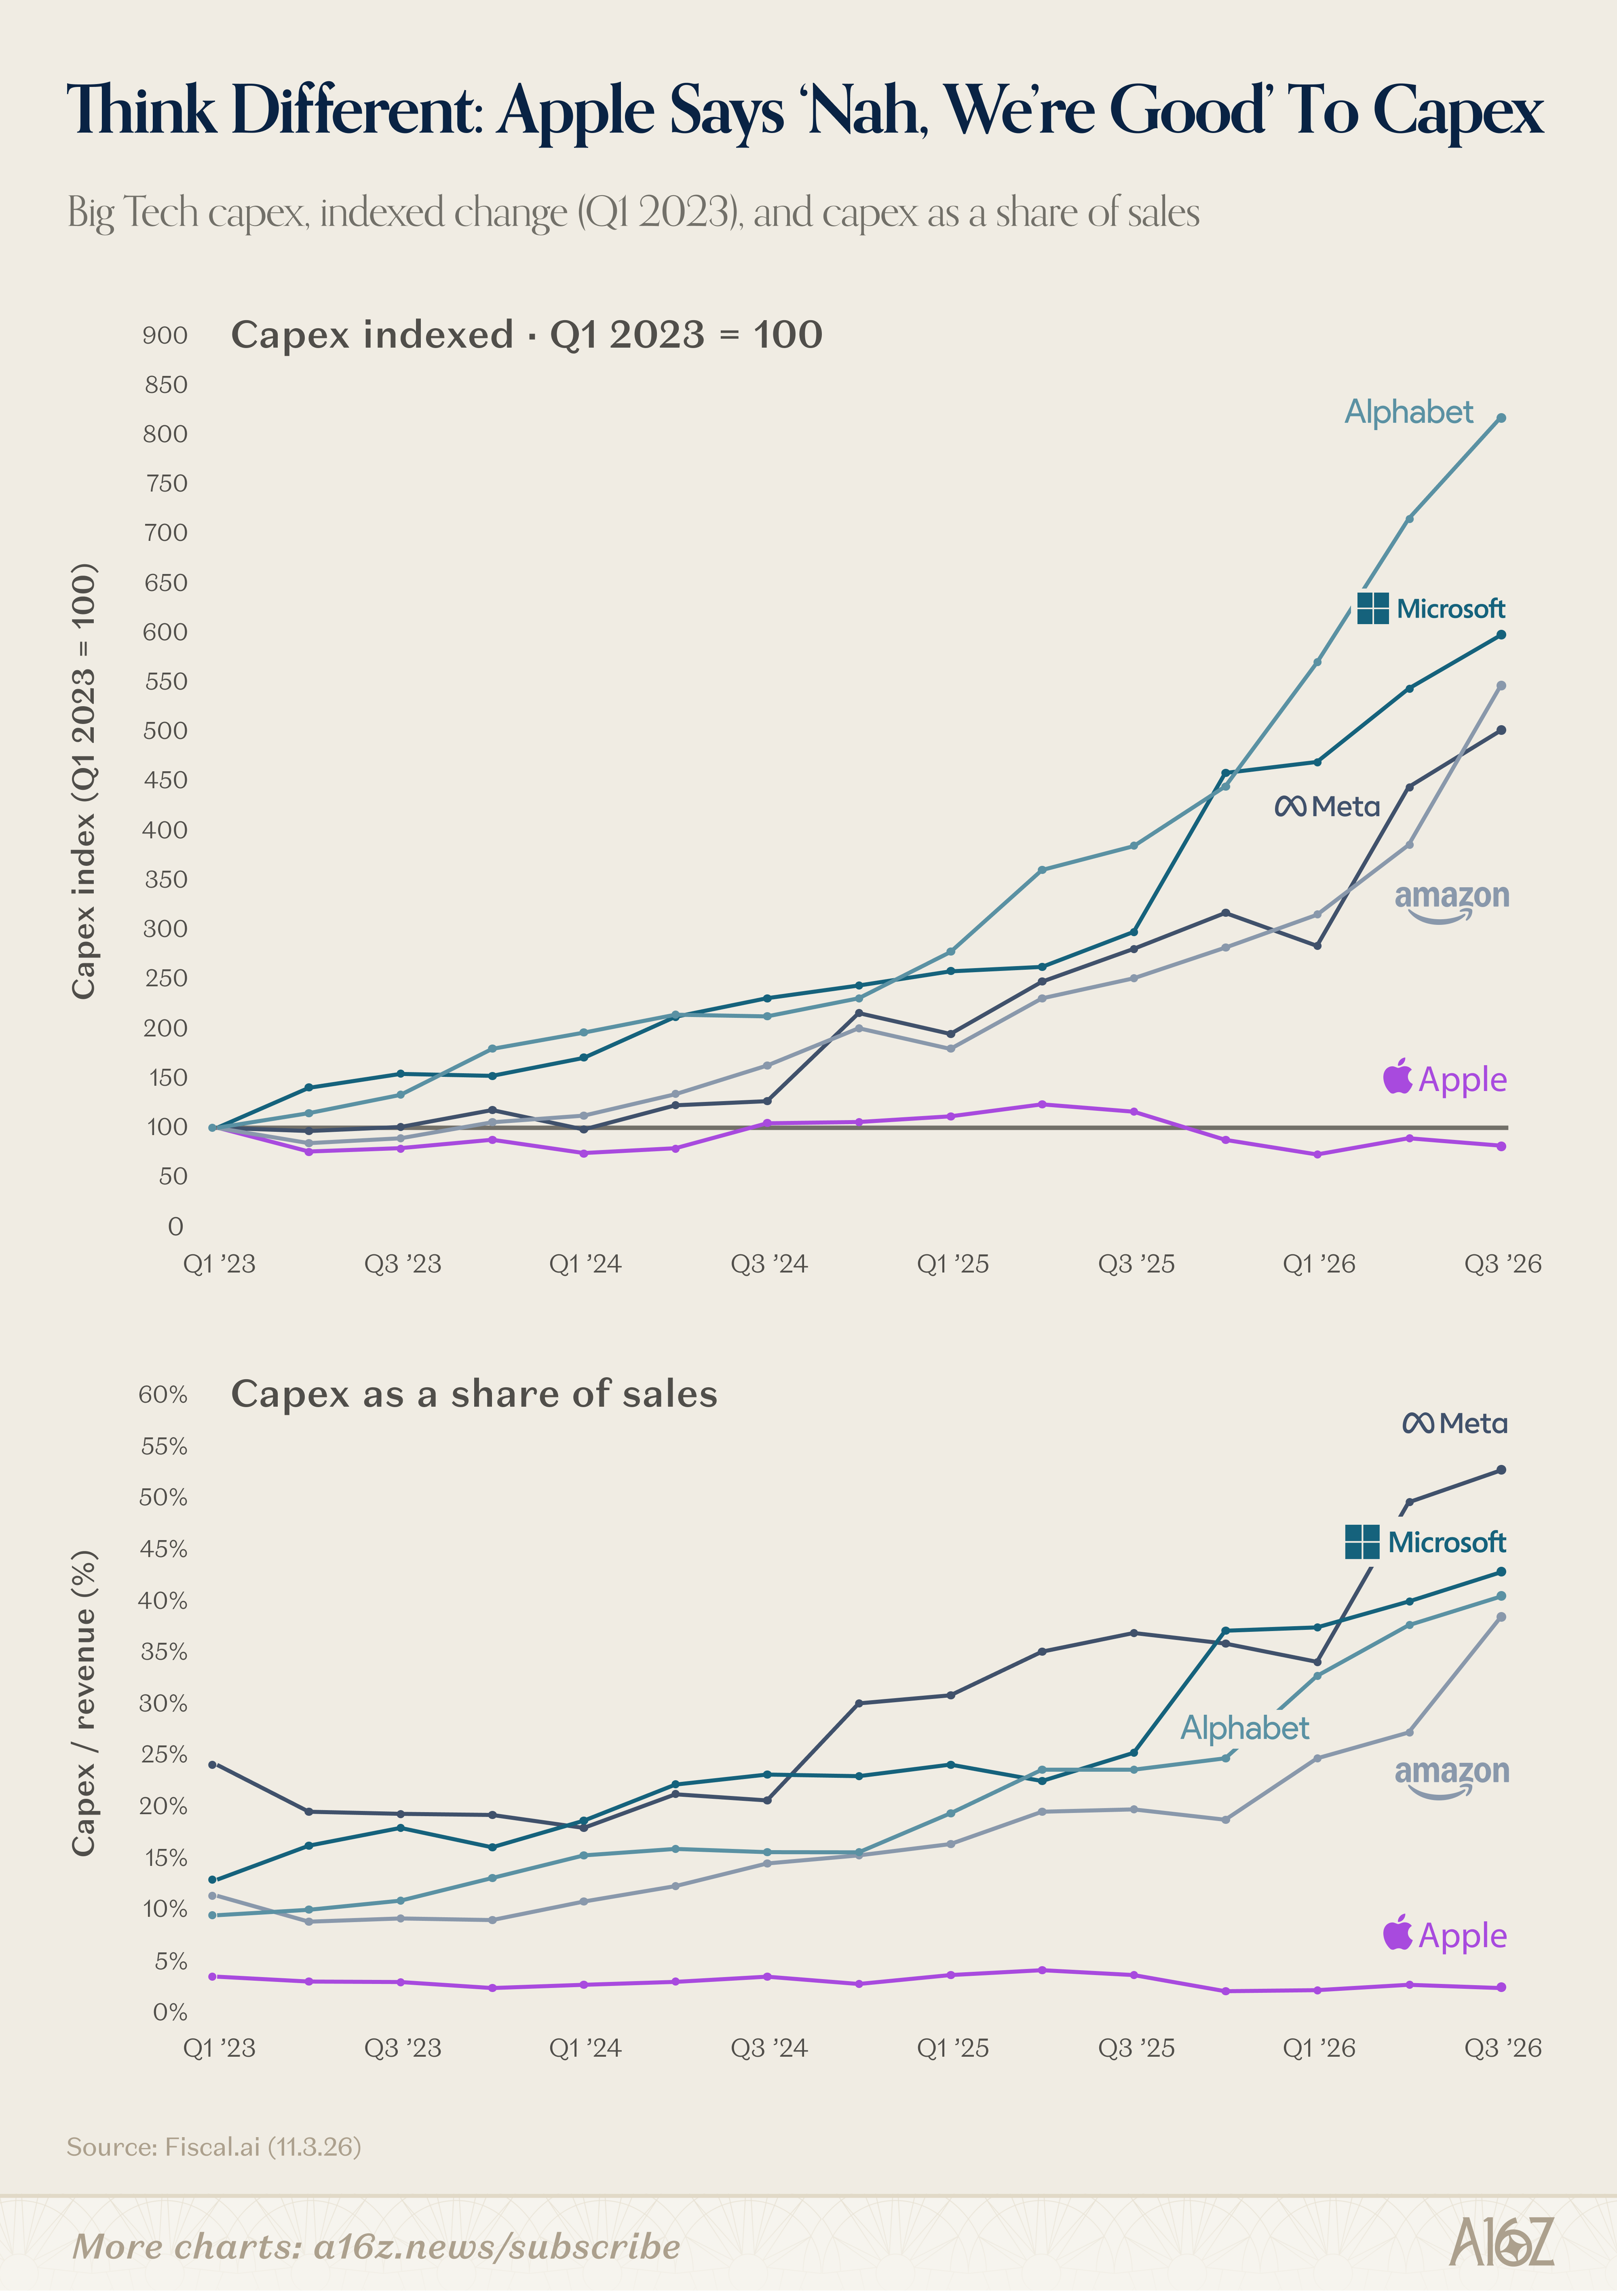
While the four main hyperscalers have increased their respective capex since 2023 anywhere from ~6x-9x, Apple’s capex is actually less than it was before the AI spending spree kicked off. The same observation can be made about capex as a % of sales: for the hyperscalers, the ratio has ~2-3xed, while for Apple, it’s declined by about a third.
None of this should be terribly surprising, but it’s still striking to see. The market is obviously rewarding Apple for not investing so much (or really anything) in AI. Instead, Apple sticks to its knitting, and the knitting has been pretty good:
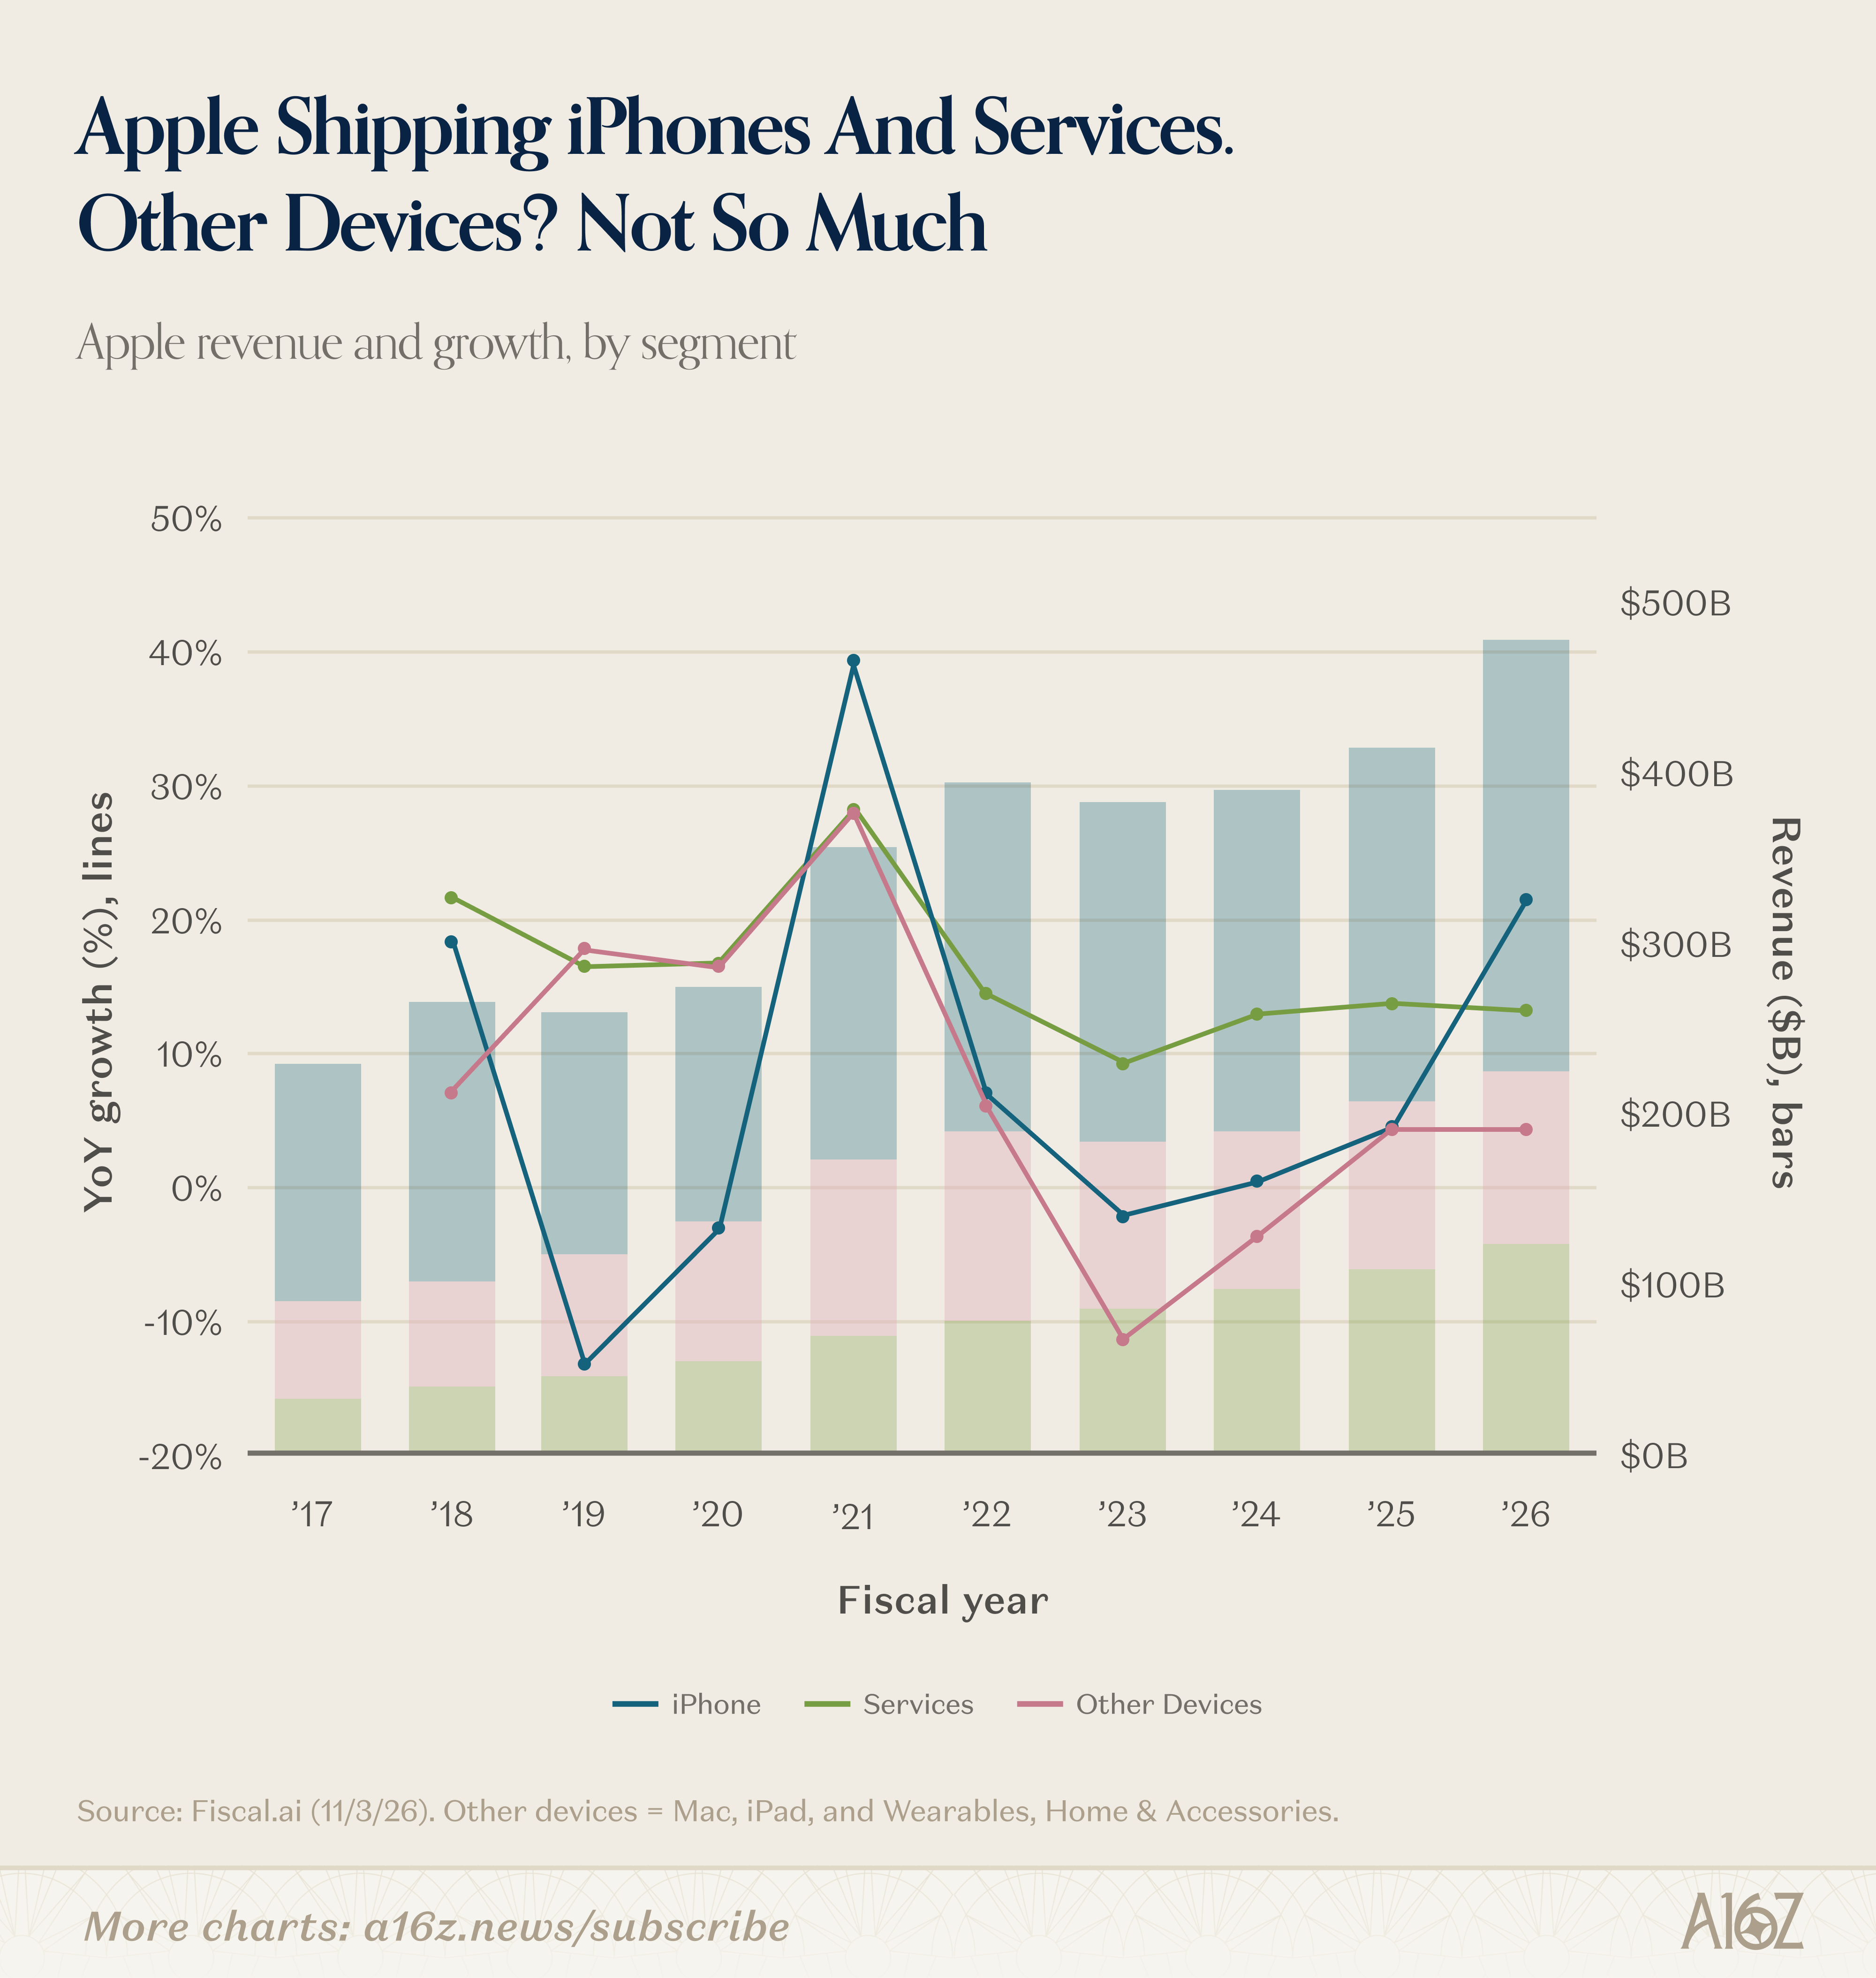
iPhone revenue growth has rebounded substantially, while services continues to compound at ~13% yoy. For all the talk of more expensive components flowing through to more expensive (and therefore, less sought after) devices, that hasn’t been the case (yet) for iPhones, at least.
If there’s any “soft spot,” it’s that the broader universe of Apple devices (Macs, iPads and wearables) has tapered off into single-digit growth.
iPads, especially, have gone from a very big deal, to a relative afterthought. When iPads were introduced back in 2010, it took only 3-4 years before iPad sales hit their high watermark:
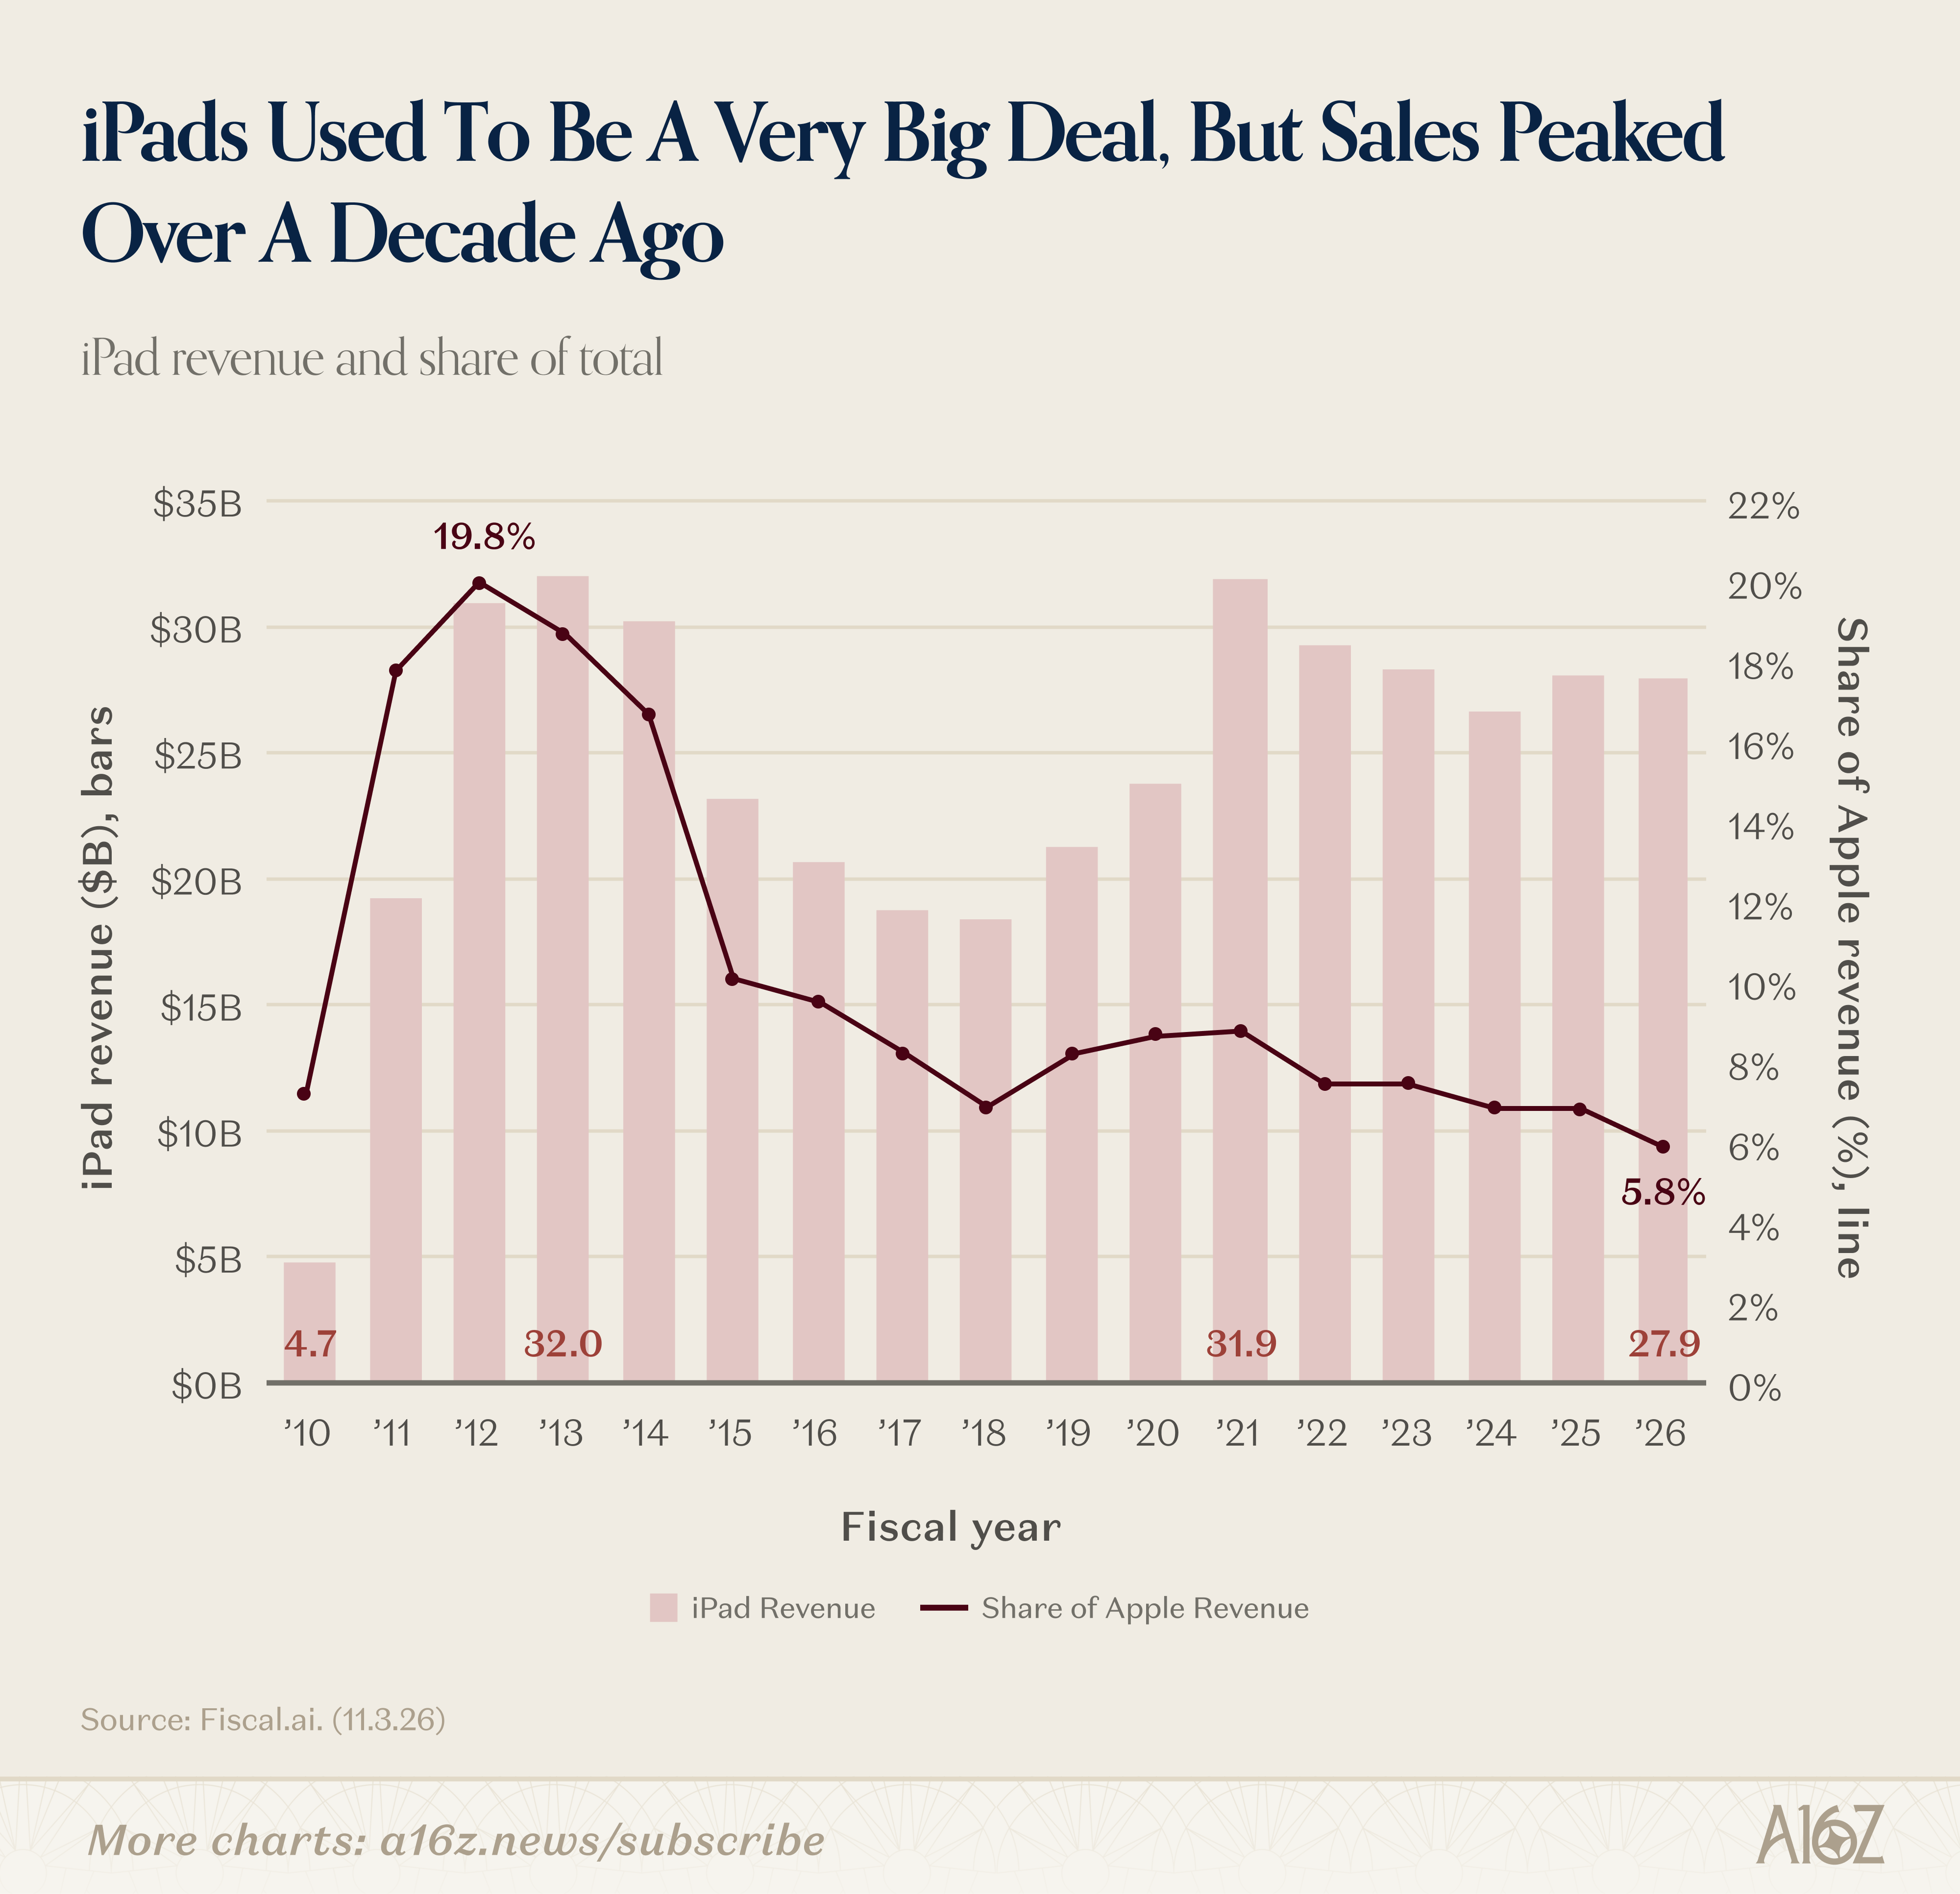
iPad sales peaked in 2013—and were nearly 20% of all of Apple’s revenue at the time—but have basically been downhill (or flat) ever since. Currently, representing less than 6% of revenue, iPads have never been less of a big deal to Apple’s overall success.
Apple has, of course, more than made up for it in other ways, but if you had said back in 2012 that the device responsible for 20% of Apple’s revenue had just hit peak sales . . . and that Apple would be just fine—more than fine, even—basically no one would have believed you. And that includes Warren Buffett, who only started buying his famous Apple position in 2016.
Think different, I guess.
Apple may be indifferent to AI, but that doesn’t mean everyone else is.
Roblox is one of the biggest games in the world, and it’s had a roller-coaster year, to put it mildly:
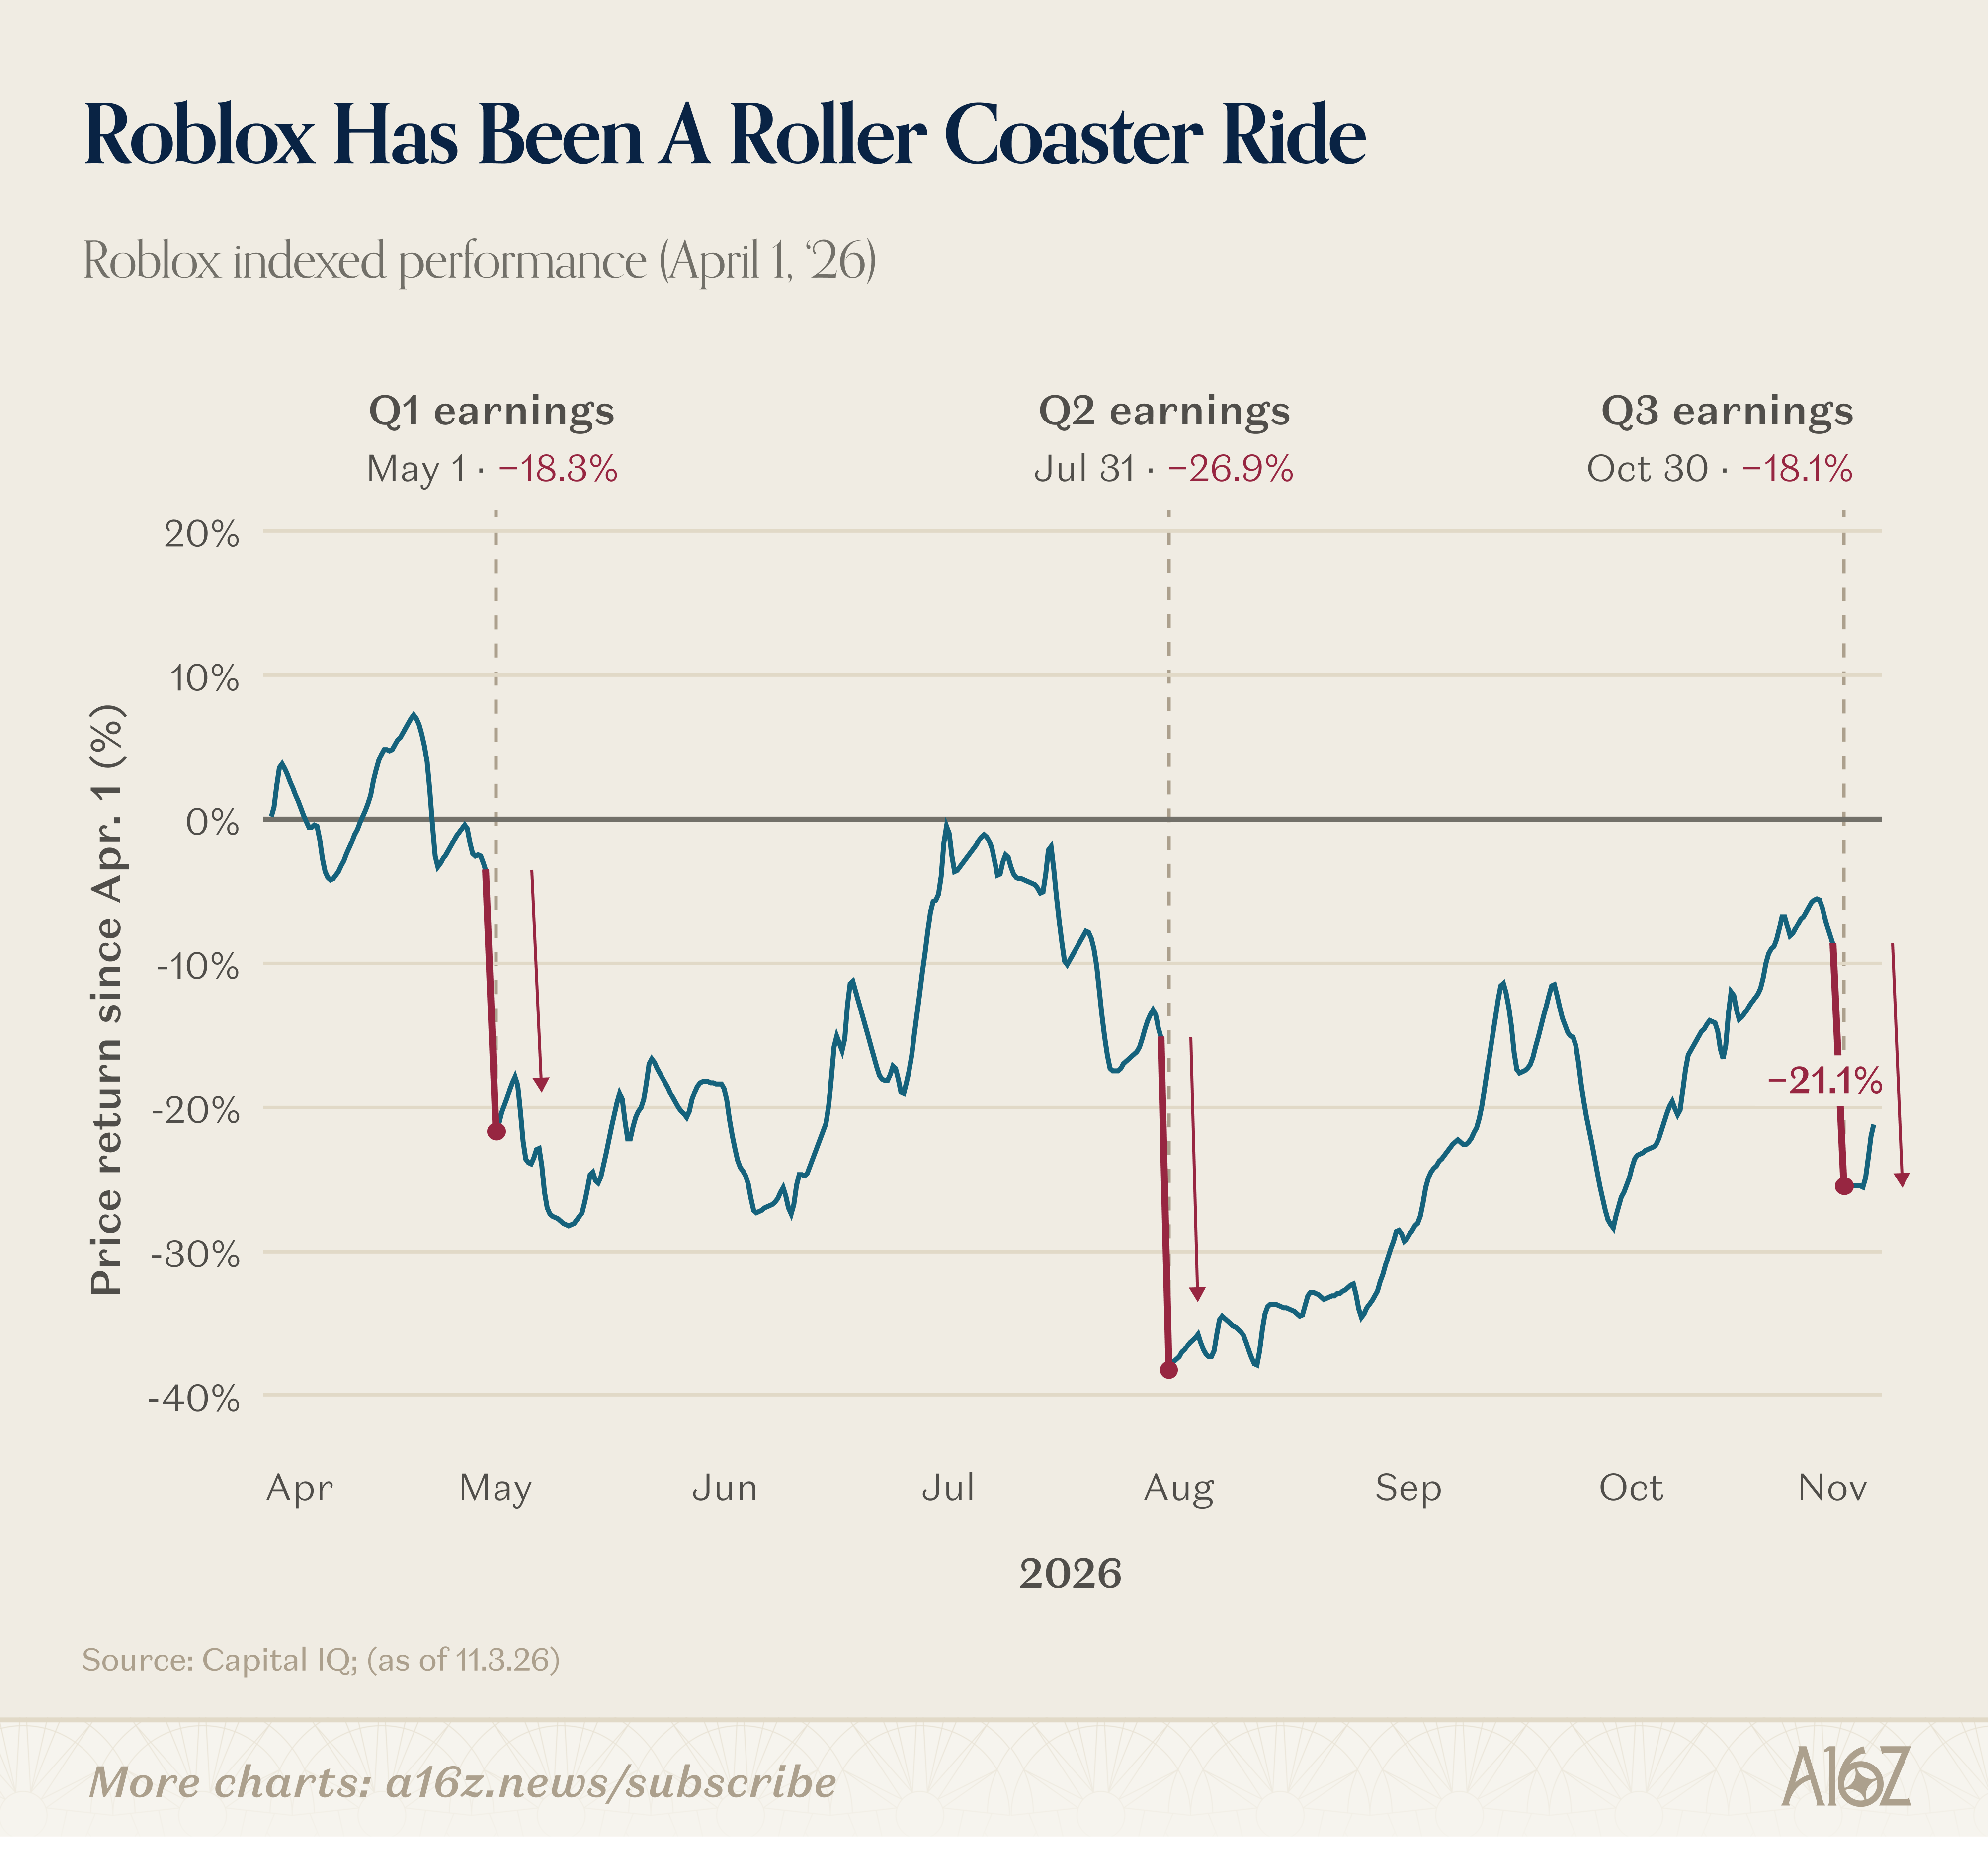
It’s an actual roller coaster. Being a Roblox shareholder must be fun.
But Charts doesn’t really care about that. What Charts cares about is the little nugget below from Roblox’s recent earnings release on the role of AI in game development. For context, Charts has variously observed in the past “so many apps, so little time,” i.e., that while AI has super-charged code output, Chrome plug-ins, app development, new websites, and the like, that doesn’t always translate into super-charged user behavior for those apps, etc. (and, in fact, in the aggregate, it has not).
Roblox, on the other hand, appears to be having a very different experience:
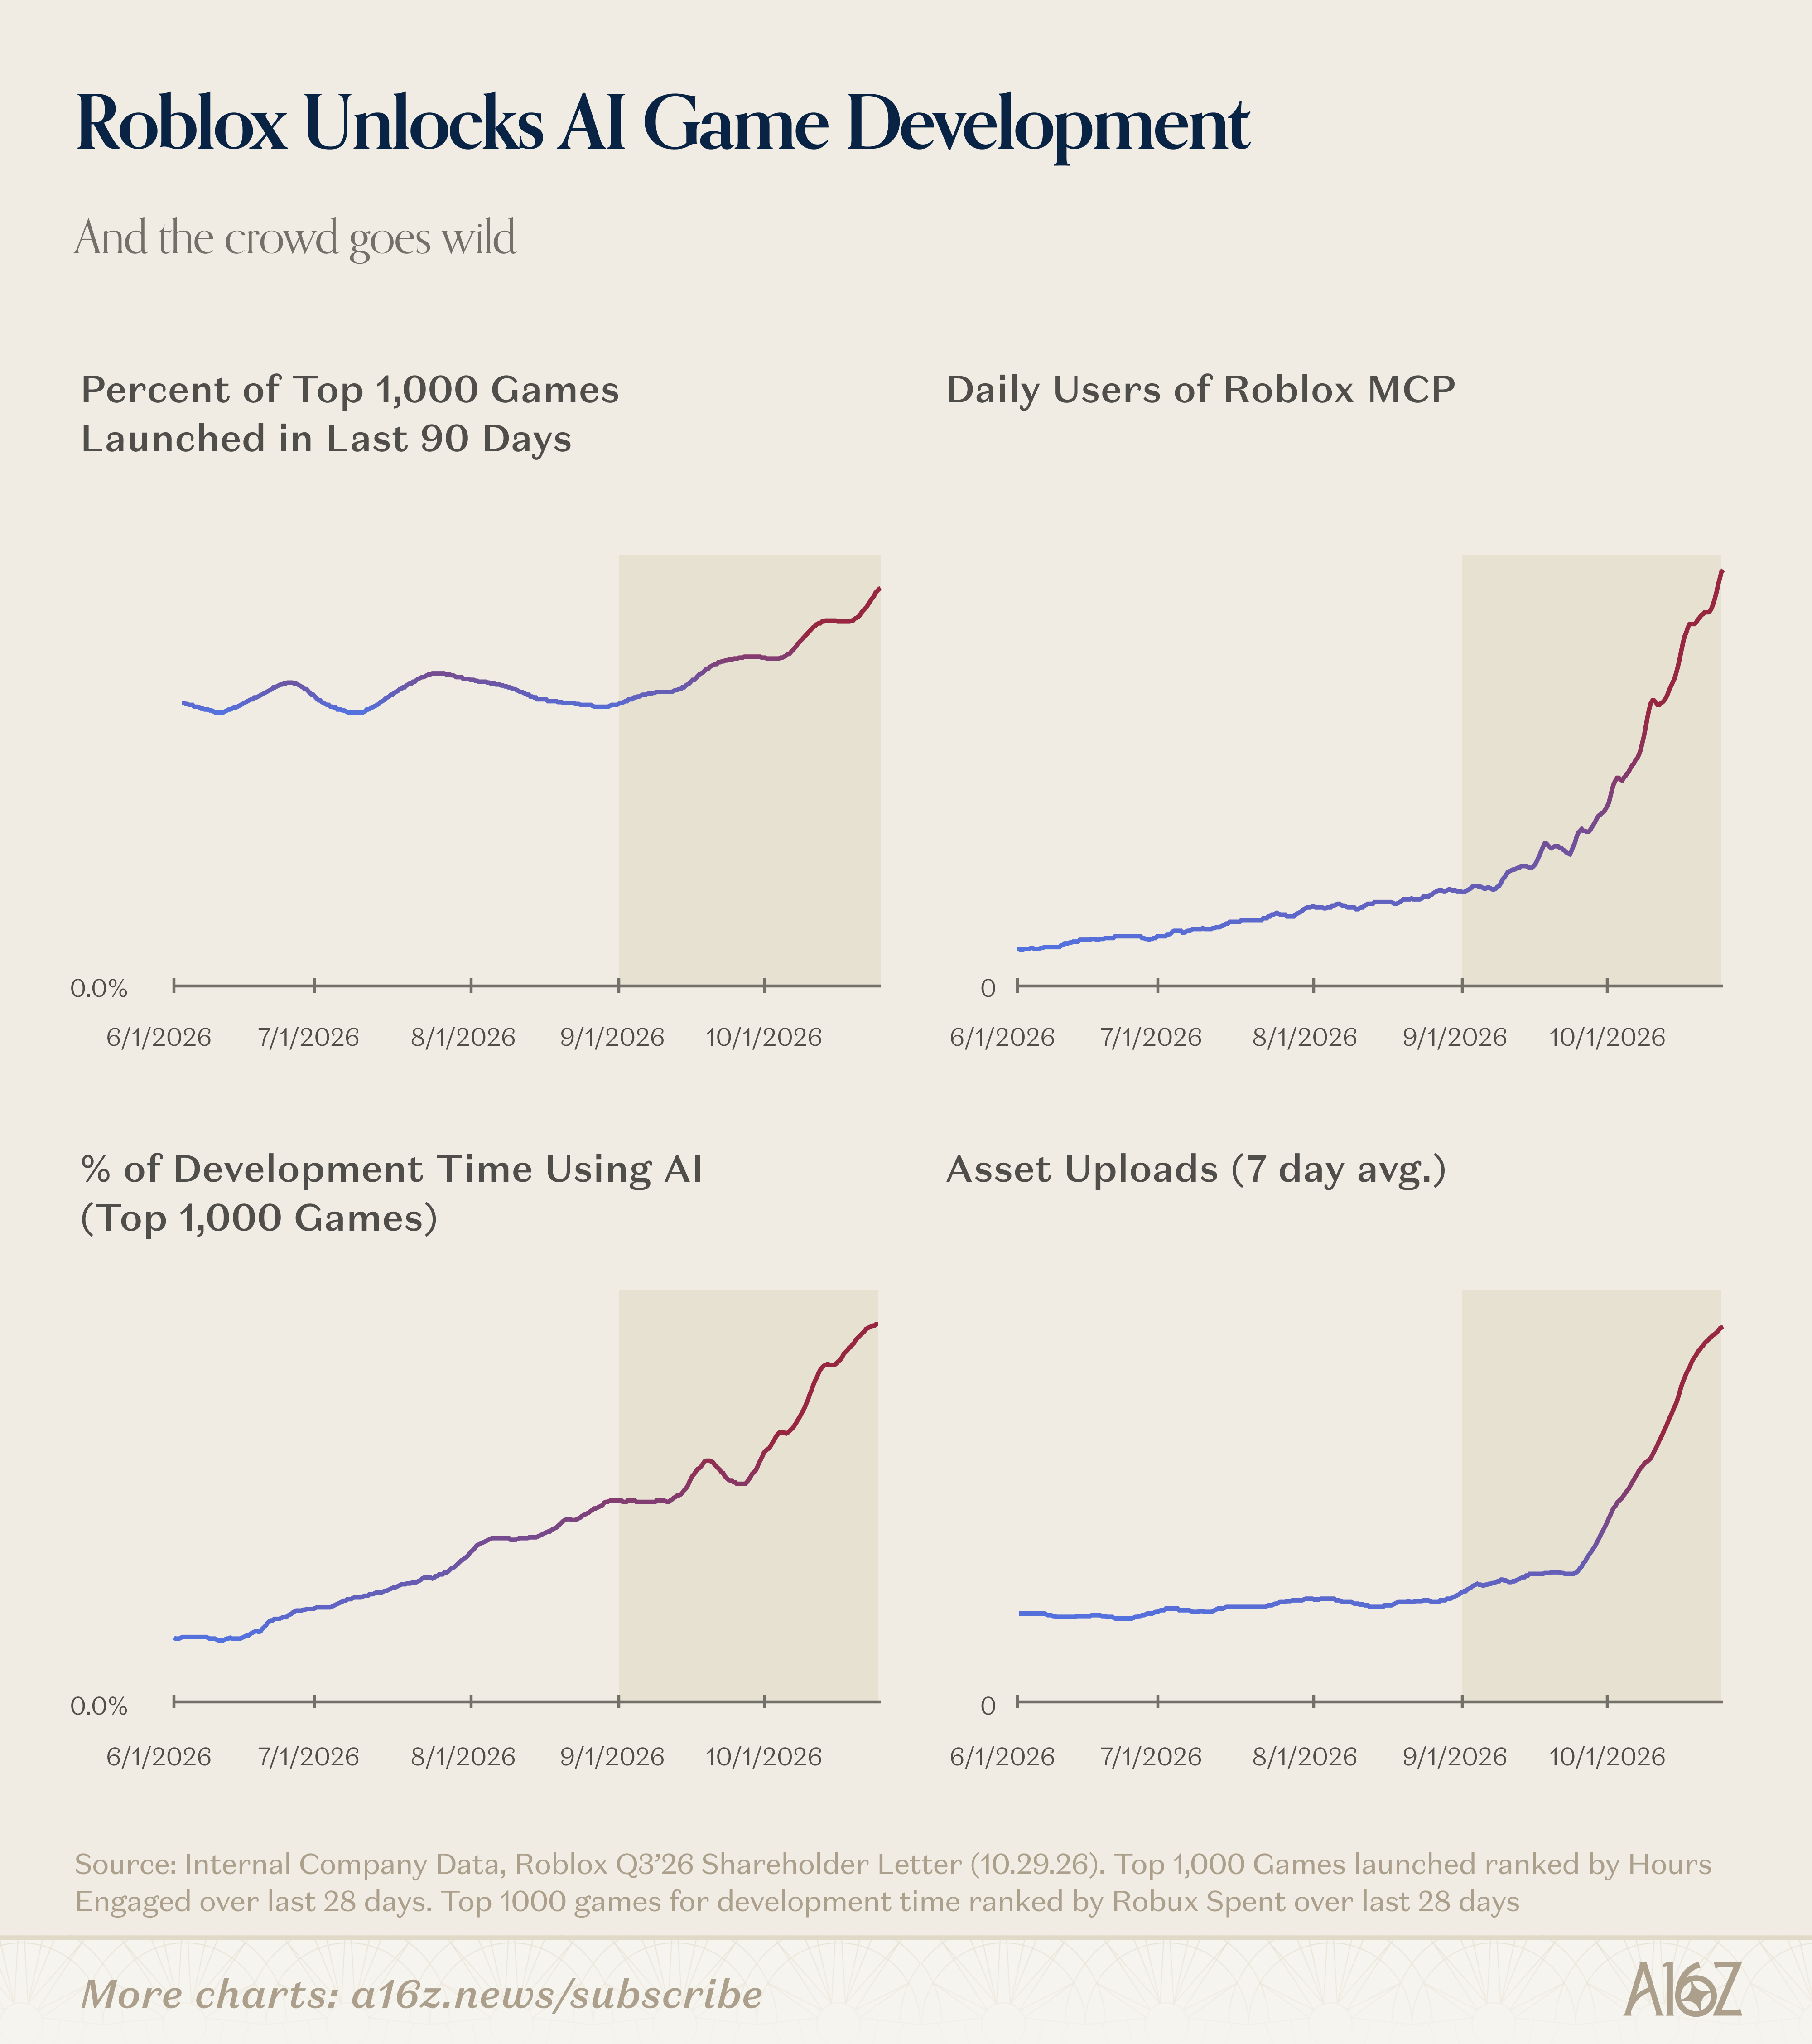
“We have been embracing AI to accelerate creation since the first release of Roblox Studio Assistant in December 2023. Over the past month, more than 80% of the top 100 games on Roblox (ranked by hours engaged) used AI tools to accelerate creation, and the number of daily asset uploads to the Roblox cloud tripled month-over-month.
Since Q2, time spent using AI tools (including Build, Studio Assistant, and external AI via MCP) tripled among our top creators, and those using our MCP server daily grew nearly 5x.
In Q3, Break and Steal an Egg and Huss Valley were both created almost entirely with AI and both broke into the Roblox top 20 (ranked by concurrent players). Build is our new prompt-to-game creation tool. Since its alpha launch in New Zealand, Singapore, Serbia and Thailand, more than 500,000 users have used Build – and have published over 70,000 games.” -Q3’26 Roblox Letter to Shareholders
OK, so those are some pretty impressive vanity metrics on the explosion of AI-driven game development from Roblox management, but the one that really jumps out is the top left: the stark rise in the share of “top games” released in the last 90 days.
In other words, people are using AI to make games—that much we’ve seen—but, in this case, other people are actually playing them. That’s a new and welcome development.
For what it’s worth, and it may not be worth much, SensorTower’s data does show a recent step-change (or recovery, depending on how you look at it) in Roblox’s userbase:
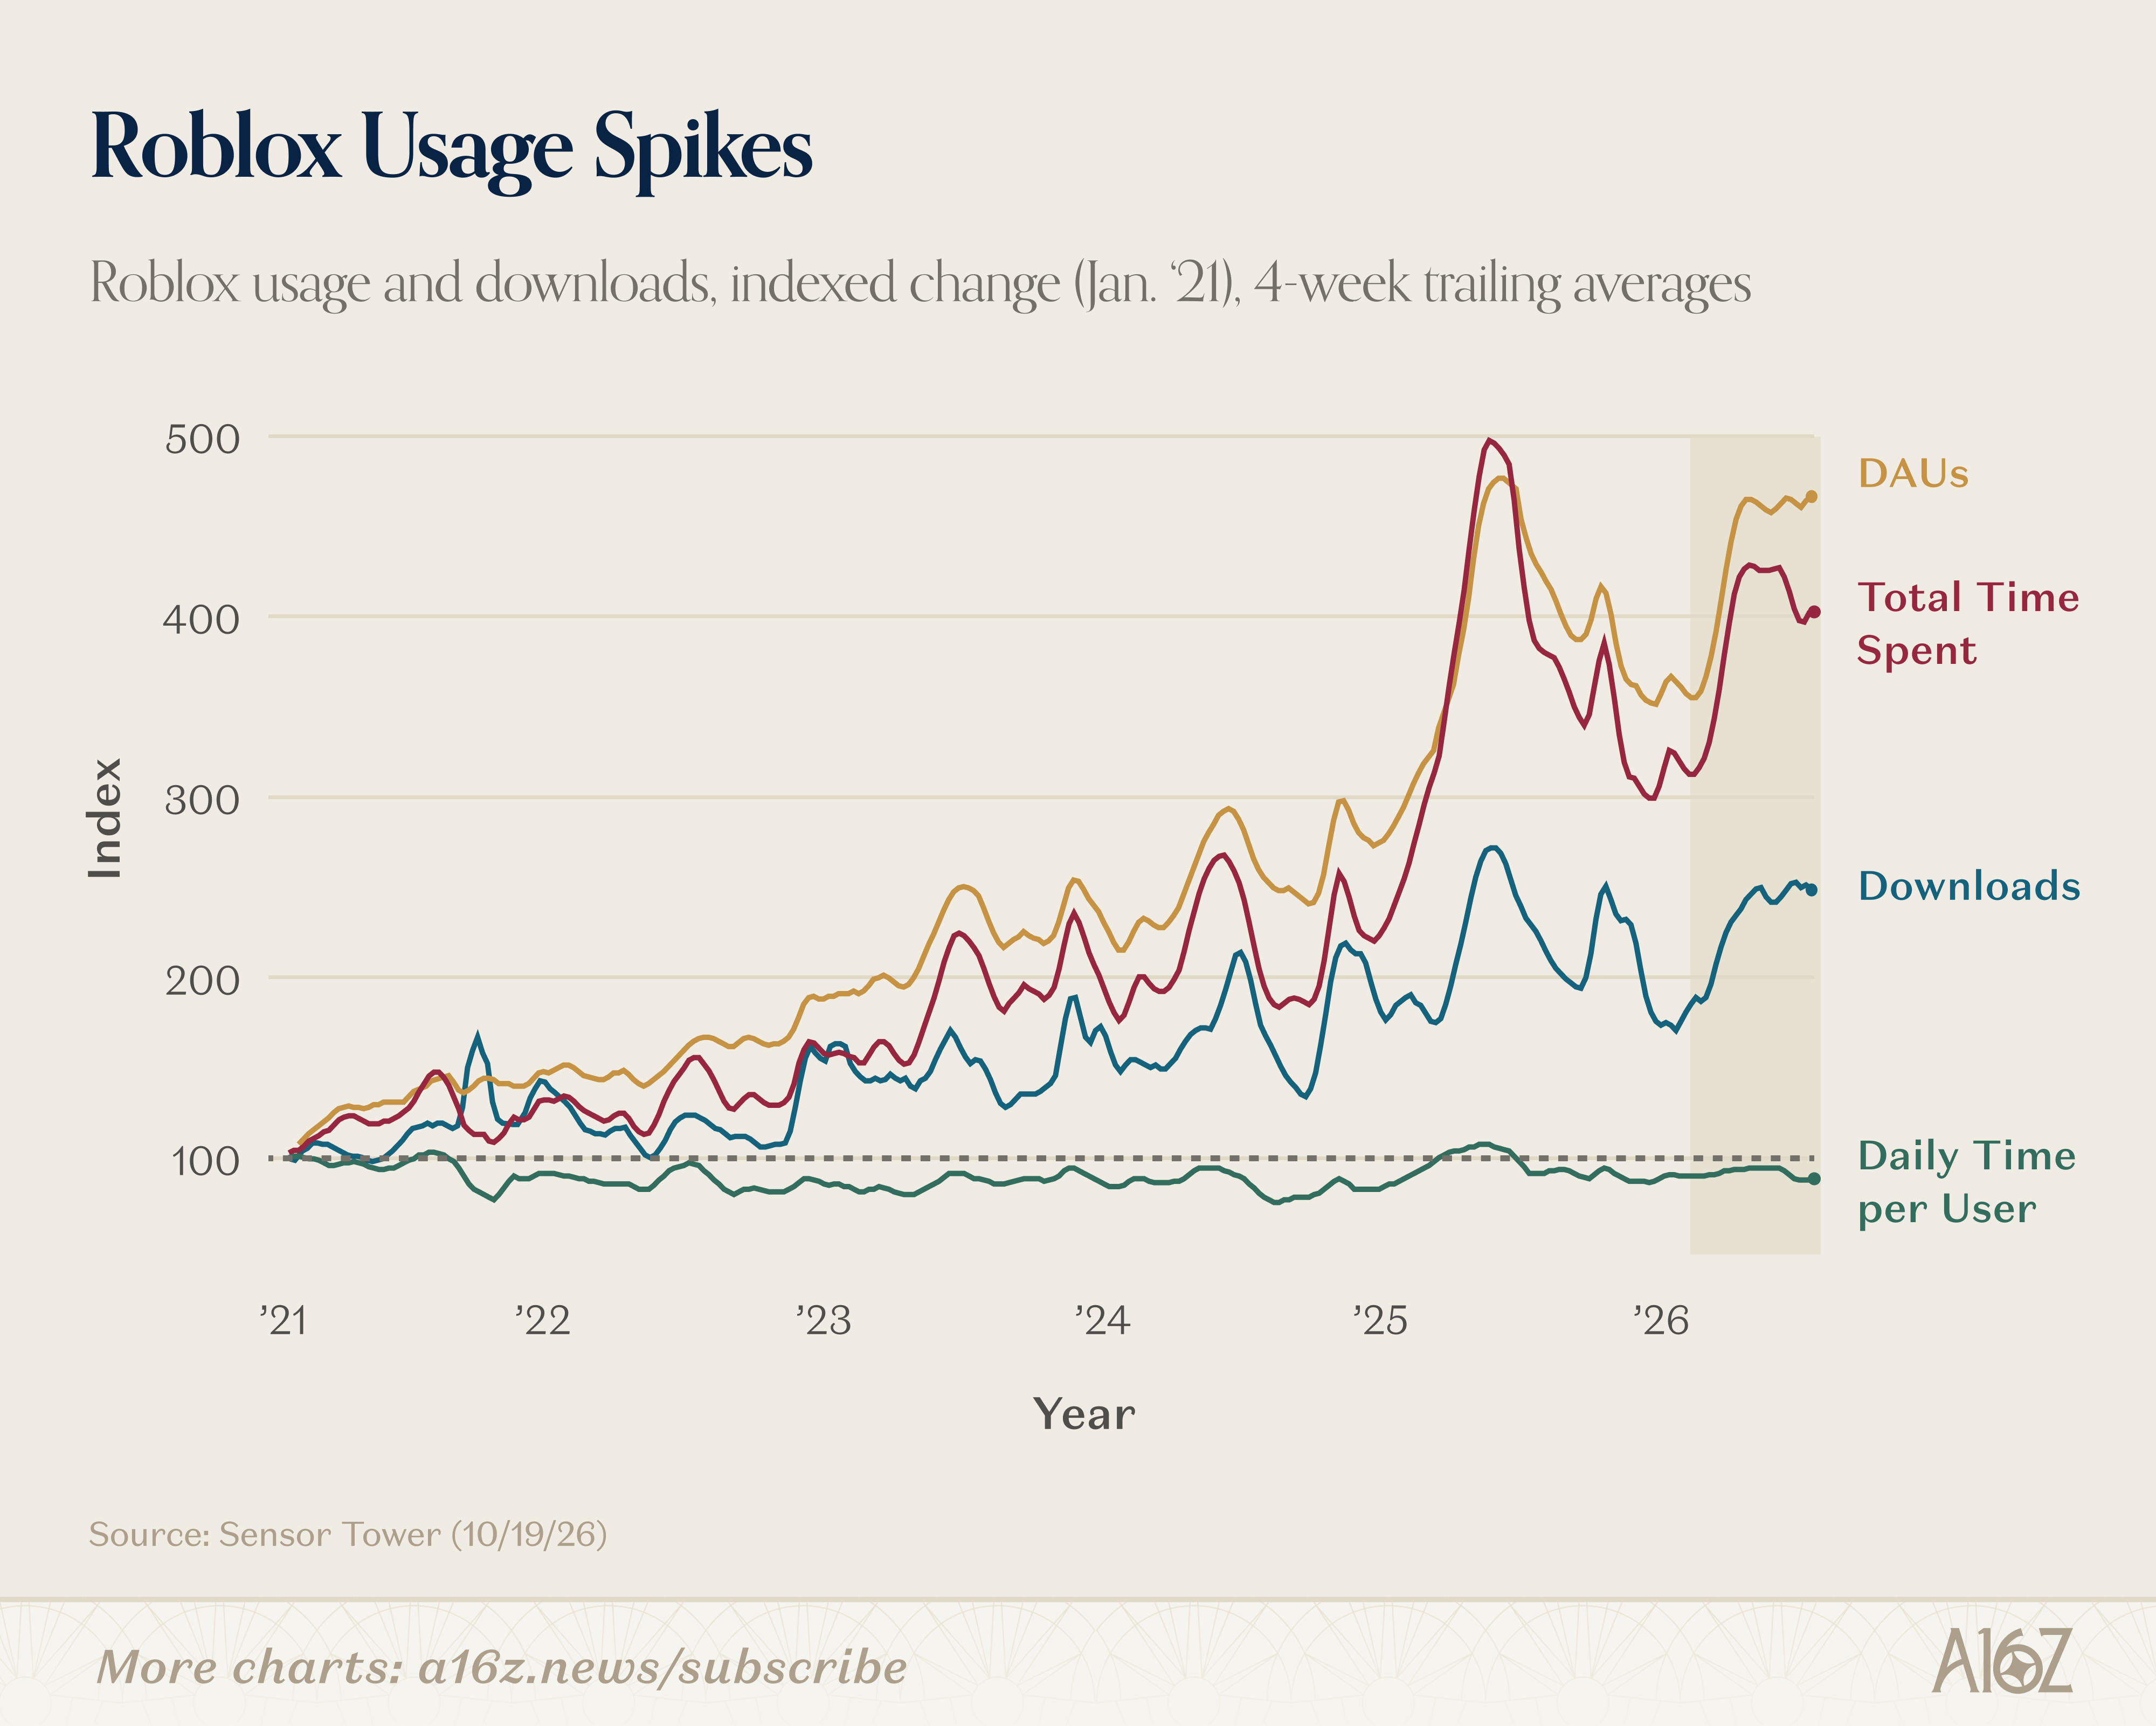
Roblox users skyrocketed back in the second half of 2025, and after some serious mean-reversion, appear to have skyrocketed once again.
Good for Roblox, one supposes. Whether that’s AI or something else, Charts has no idea, but perhaps it’s not all AI Appslop, after all.
You may have read recently about all the other peptides, so what better occasion to drop some fun facts about GLP-1s.
More specifically, what happens to the food spending habits of GLP-1 users, after they’ve stuck with GLP-1s for a while?
According to some Circana data, surfaced by Dan Frommer of The New Consumer, the results are a little surprising: GLP-1 households still spend more on food than the average household, and when it comes to food services, they actually spend more than before:
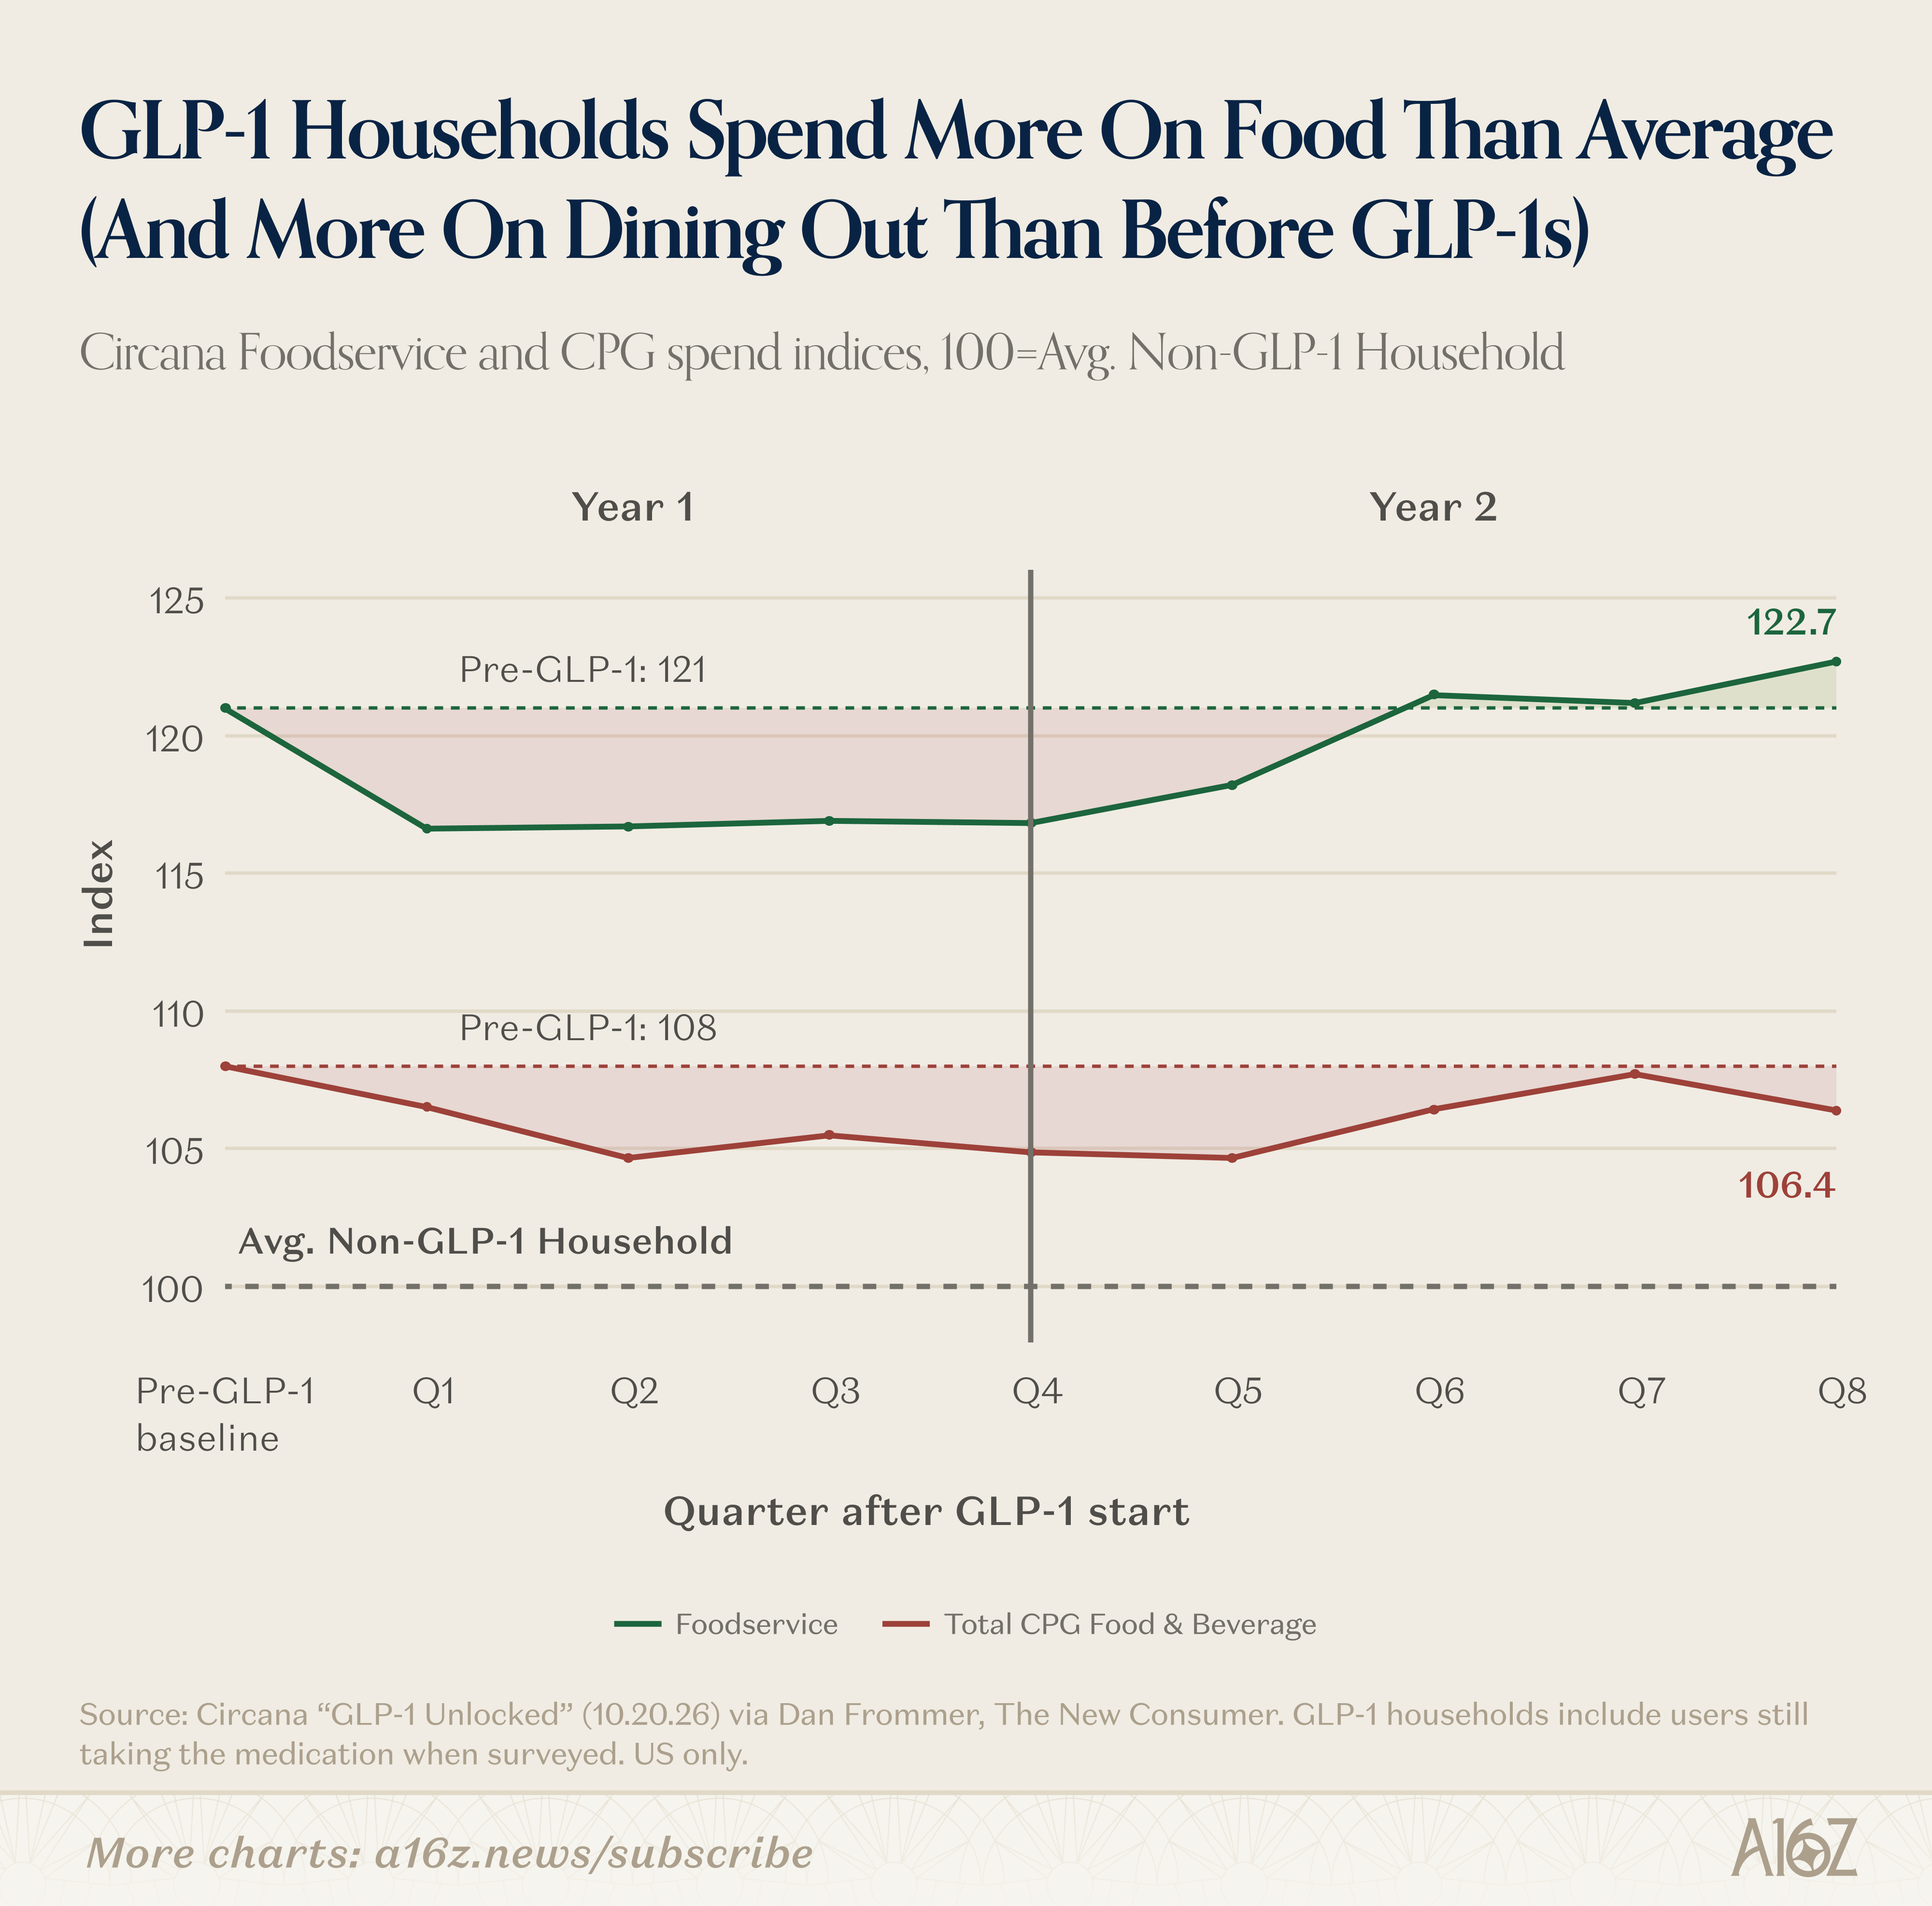
GLP-1 households started out as above-average spenders, and while both store-spending and away-from-home food spending decline initially, they both begin to recover in Year 2. Food-service spending (i.e. dining out) actually ends up slightly higher than the pre-GLP-1 baseline by the middle of the second year.
If GLP-1 users are spending more on food than they did before, does that make GLP-1s a waste of their time? No, probably not.
It more likely means that GLP-1 households shifted their food spending habits from less-healthy things to more healthy things, that are perhaps a bit more expensive:
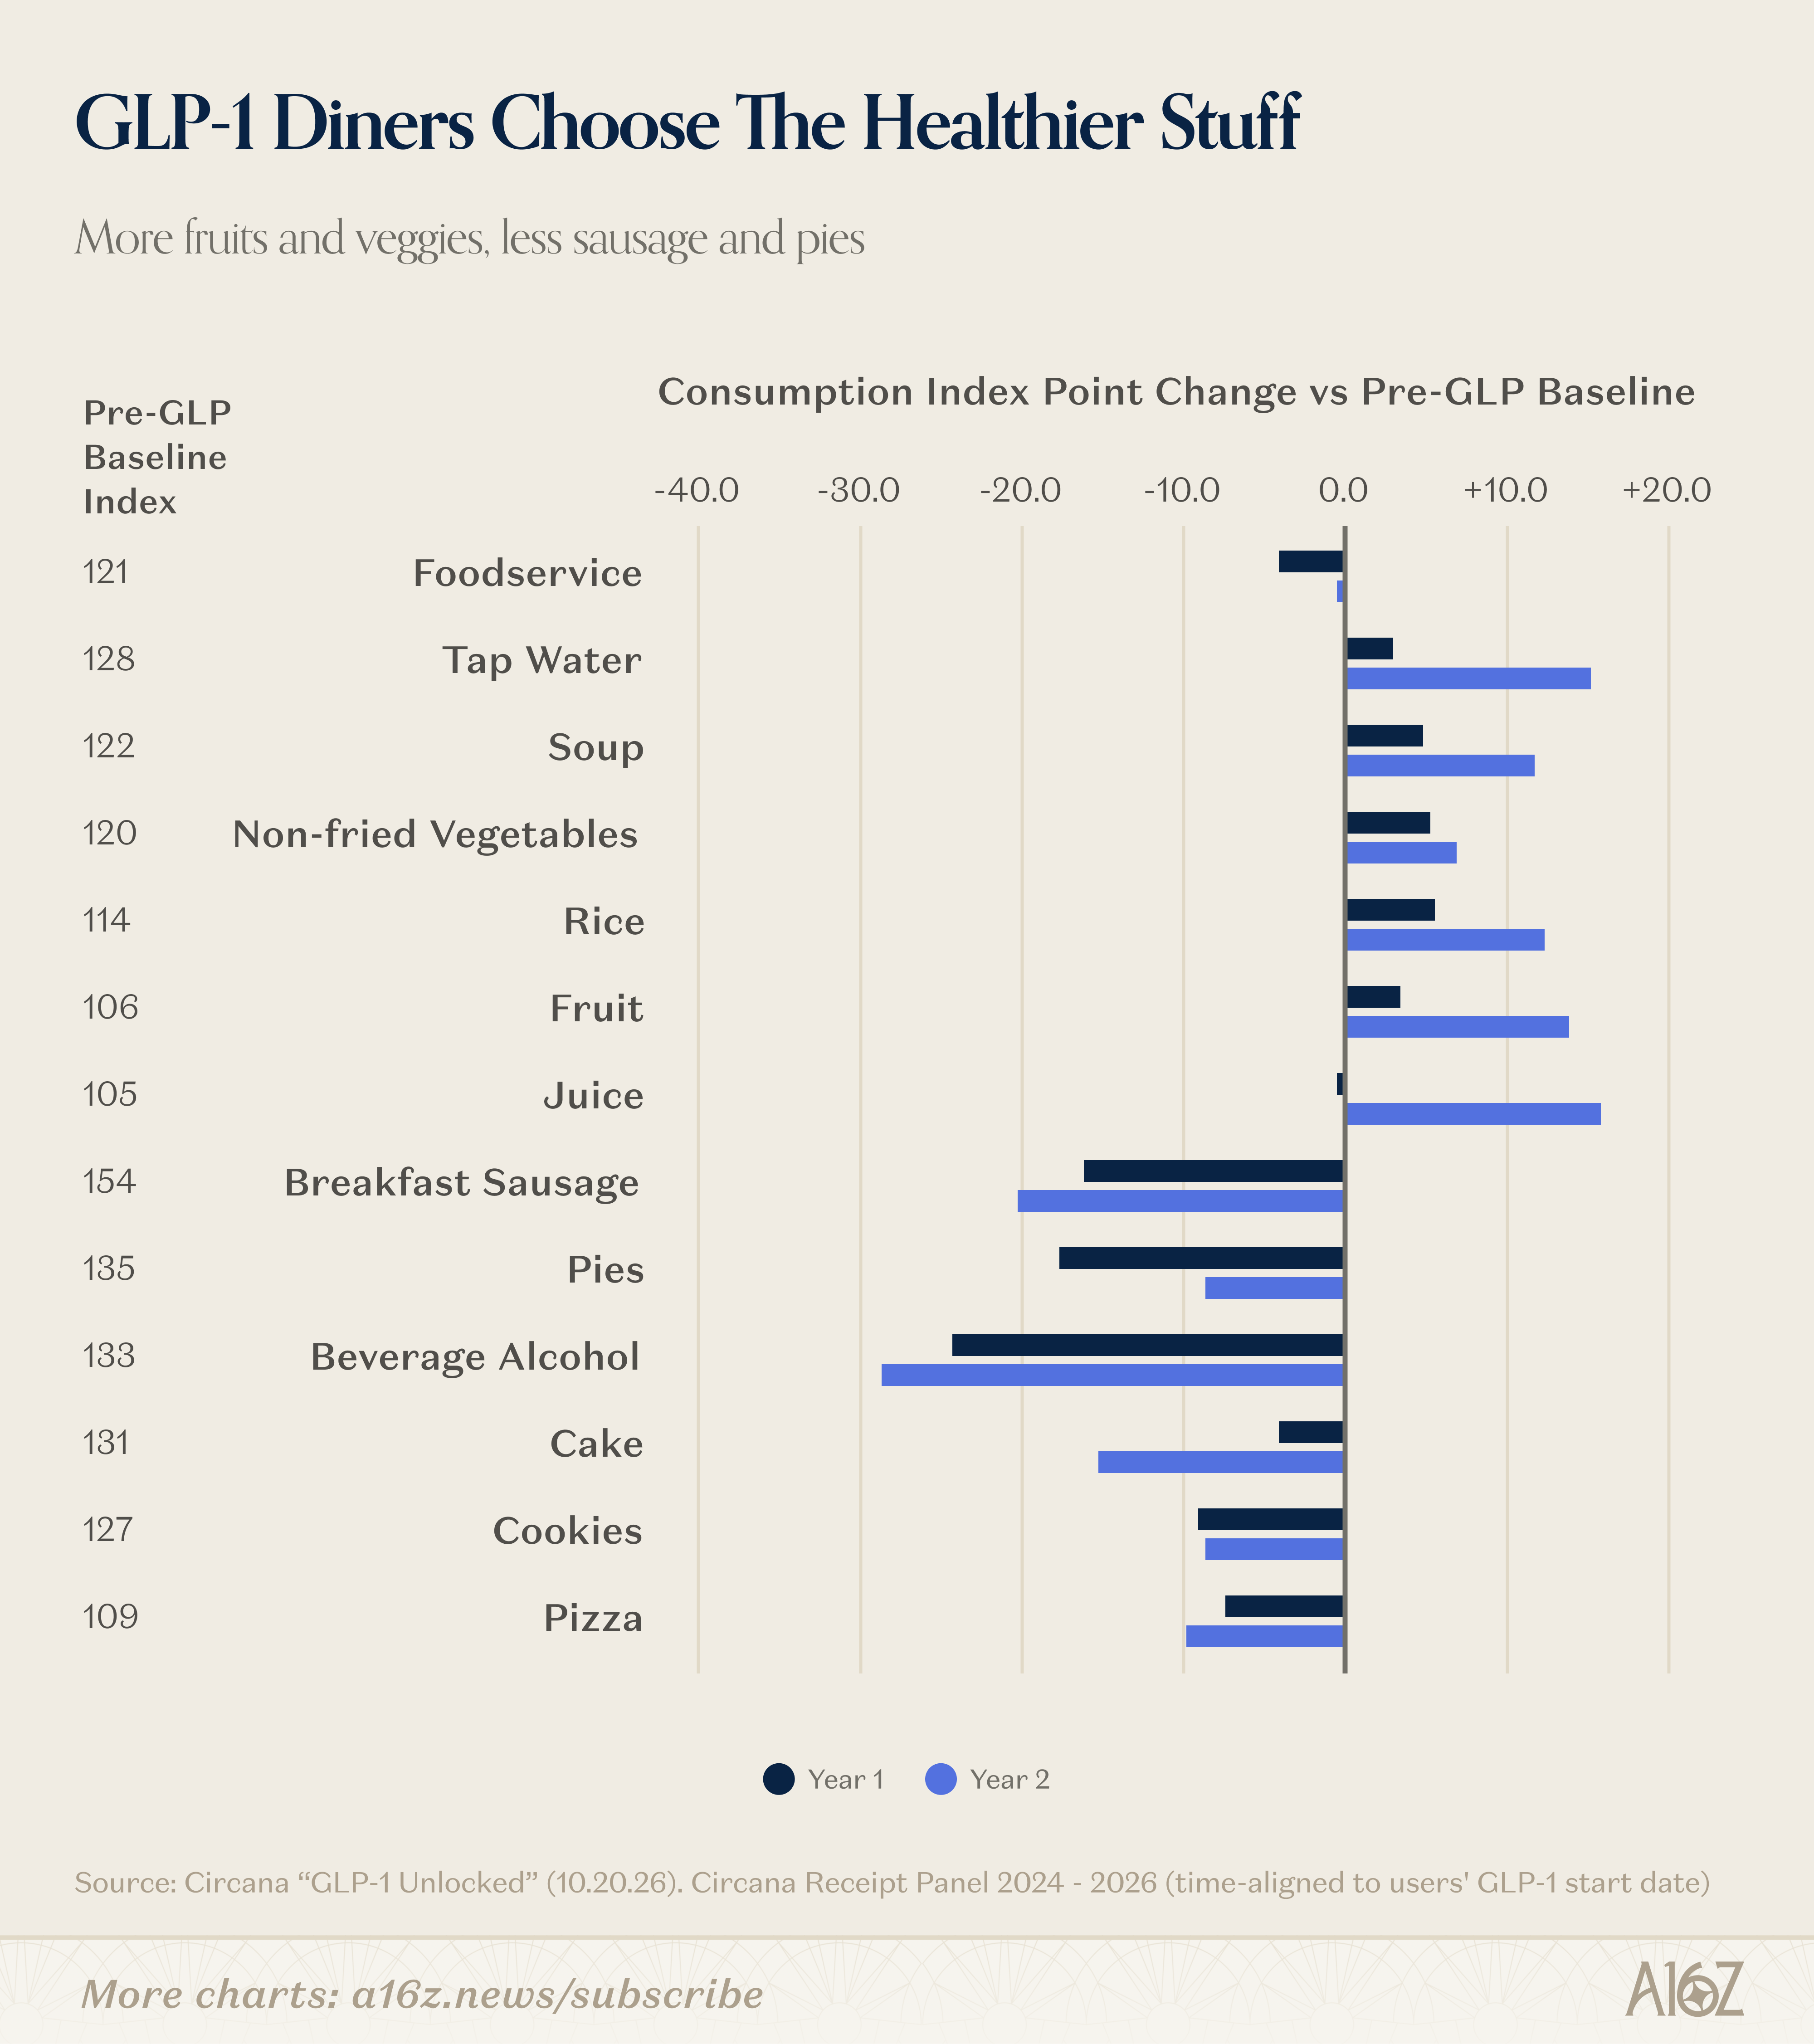
Year 1 and especially Year 2 post-GLP-1 diners had big shifts towards water, soup, rice, and fruits and veggies, and big shifts away from sausage, pies, and alcohol. (Note that Charts is unsure how “tap water” would show up in receipt data, but we’re just gonna roll with it.)
As a shift to more expensive, but healthier, that checks out. Alcohol consumption especially, really does appear to change, as GLP-1 users were average or above-average booze-spenders before they started treatment, but by year 2, are well-below average for every category of alcohol, with the exception of wine (which increases moderately).
There’s another unlikely takeaway here. When GLP-1s took off, many predicted a collapse for the dining and CPG industries. But, rather than a food-spending GLPocalypse, there appears to be a moderate lift to food-spending, albeit with a substantial shift (and the industry has adapted accordingly). That seems pretty good.
There is one final interesting aside, which may be something or nothing, or may raise some questions about the noisiness of the data. There is at least some vice that seems to benefit substantially from GLP-1 users:
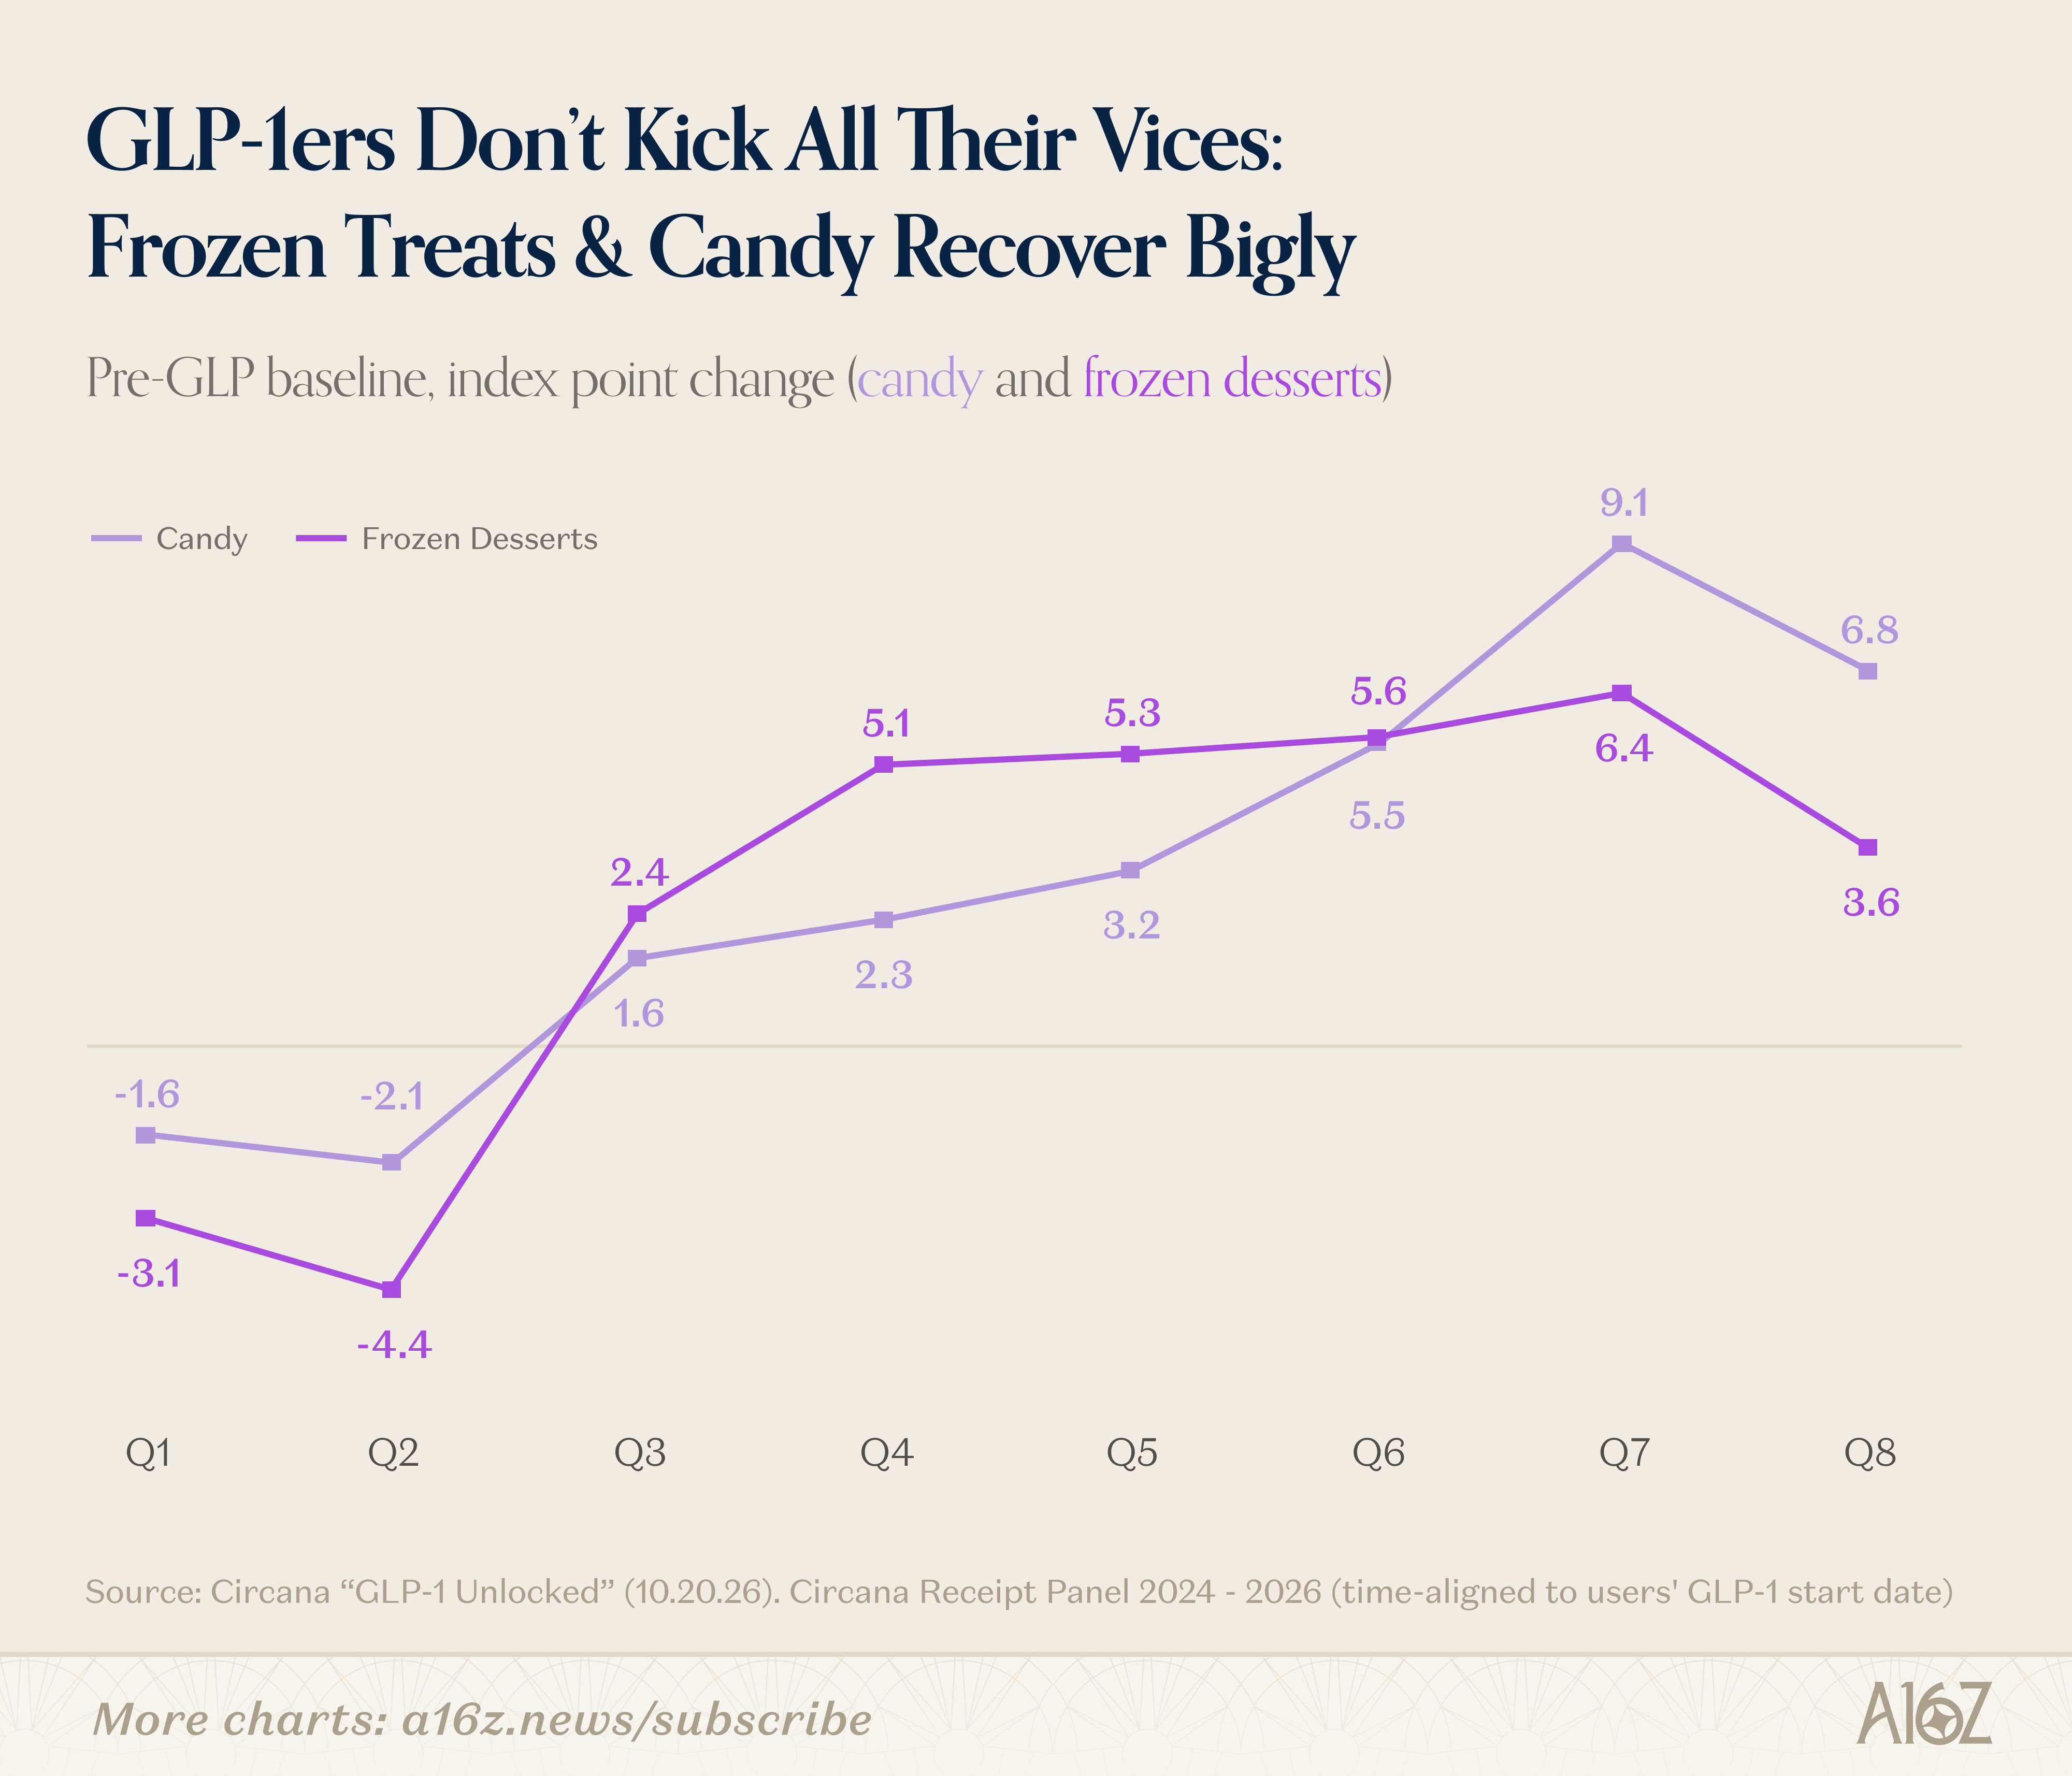
Candy and frozen treat spending both increased substantially over the first 2 years of treatment, such that below-average spenders became above-average spenders of both.
Again, maybe that’s just noisy data, or maybe there are some substitution effects at play here, as well (for the better). Perhaps instead of pies, cookies and cake, people switch to popsicles and ice cream, instead? And that’s probably a bit healthier?
Finally, just a little chart-tribute to the dictionary.com “word” of the year: “maxxing.”
Maxxing is, of course, not a word in the traditional sense, but it’s been an awfully popular turn of phrase in 2026:
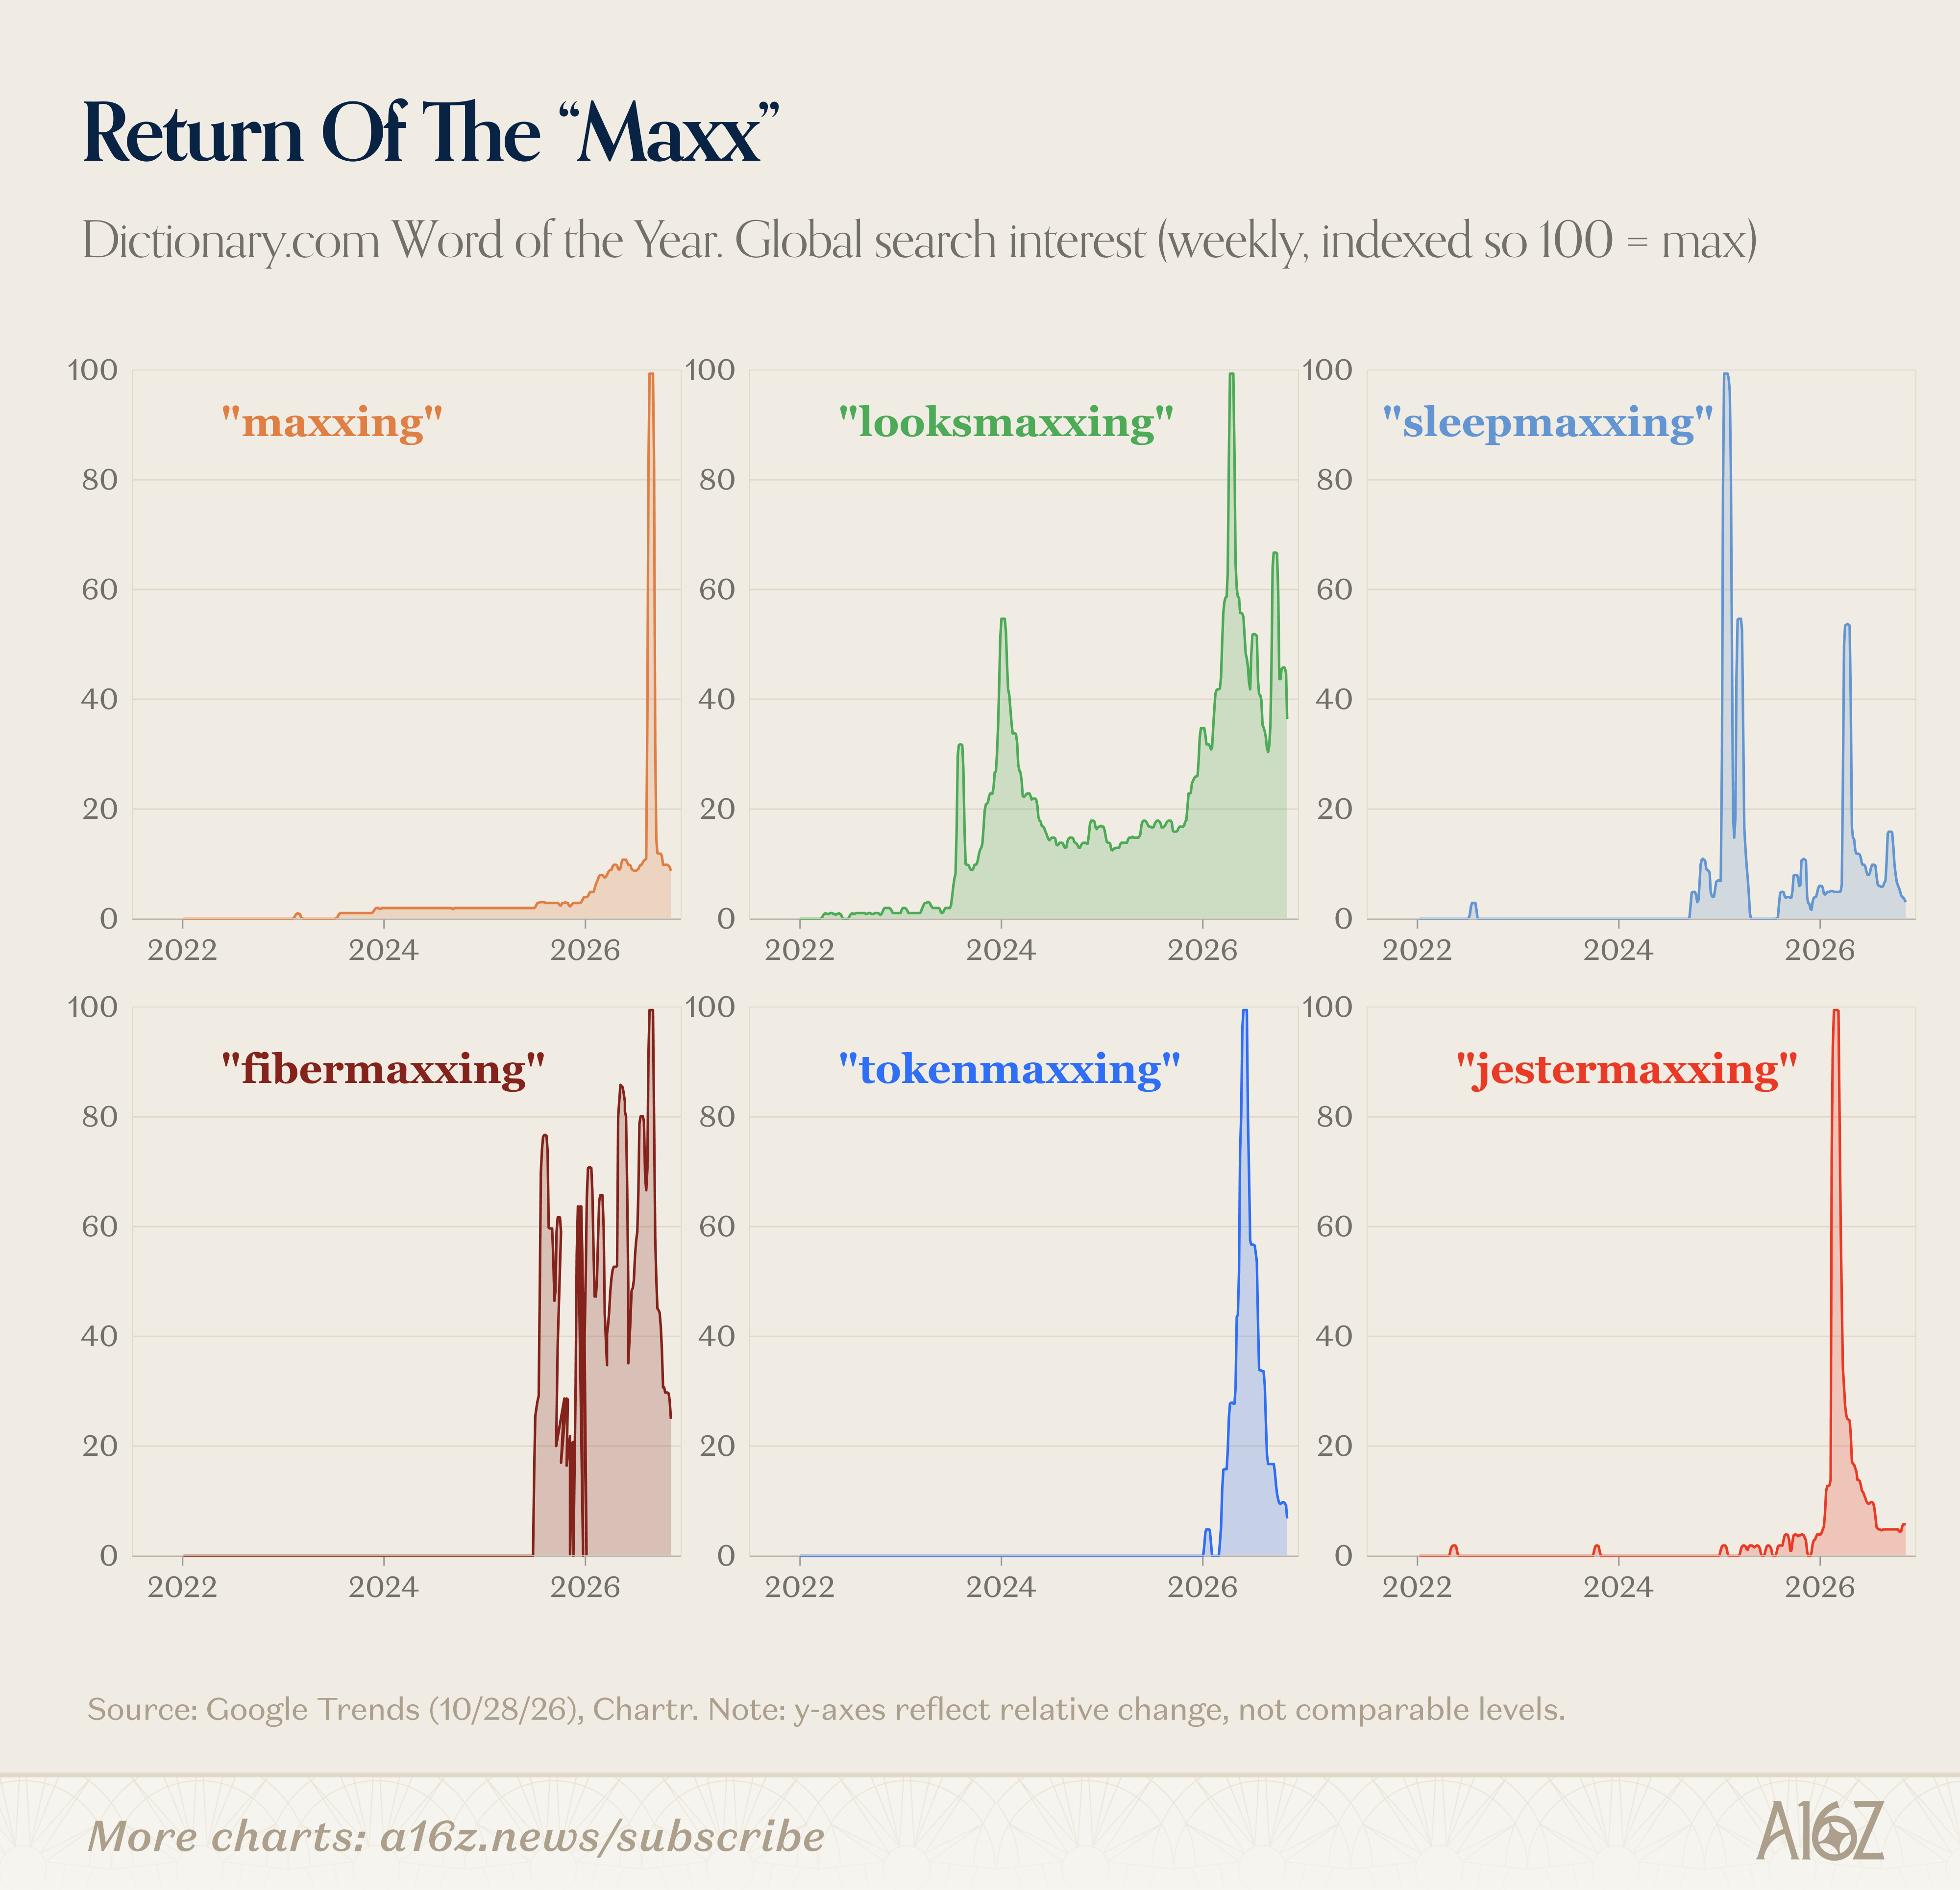
Search interest in various iterations of “maxxing” spiked in 2026 (although “sleepmaxxing” appears to have peaked last year), with “maxxing” itself growing nearly 20x since the beginning of the year. Congrats, everyone. We officially maxxmaxxed.
Maxxing beat runners-up, “affordability,” “data center,” “Odyssey,” and “Unc,” for the 2026 crown. Make of that what you will.
This newsletter is provided for informational purposes only, and should not be relied upon as legal, business, investment, or tax advice. Furthermore, this content is not investment advice, nor is it intended for use by any investors or prospective investors in any a16z funds. This newsletter may link to other websites or contain other information obtained from third-party sources - a16z has not independently verified nor makes any representations about the current or enduring accuracy of such information. If this content includes third-party advertisements, a16z has not reviewed such advertisements and does not endorse any advertising content or related companies contained therein. Any investments or portfolio companies mentioned, referred to, or described are not representative of all investments in vehicles managed by a16z; visit https://a16z.com/investment-list/ for a full list of investments. Other important information can be found at a16z.com/disclosures. You’re receiving this newsletter since you opted in earlier; if you would like to opt out of future newsletters you may unsubscribe immediately.
来源:a16z:News · a16z.news